In this article, I will go over the following.
- Features of the Stock Lookup template
- Introduction to the Stocks data type
- 2 types of formulas to retrieve this data and refresh.
- Some issues or gaps I experienced
Download
Video Demo
Stock Lookup Template features
Type a ticker symbol to see relevant info. Example: I type in MSFT
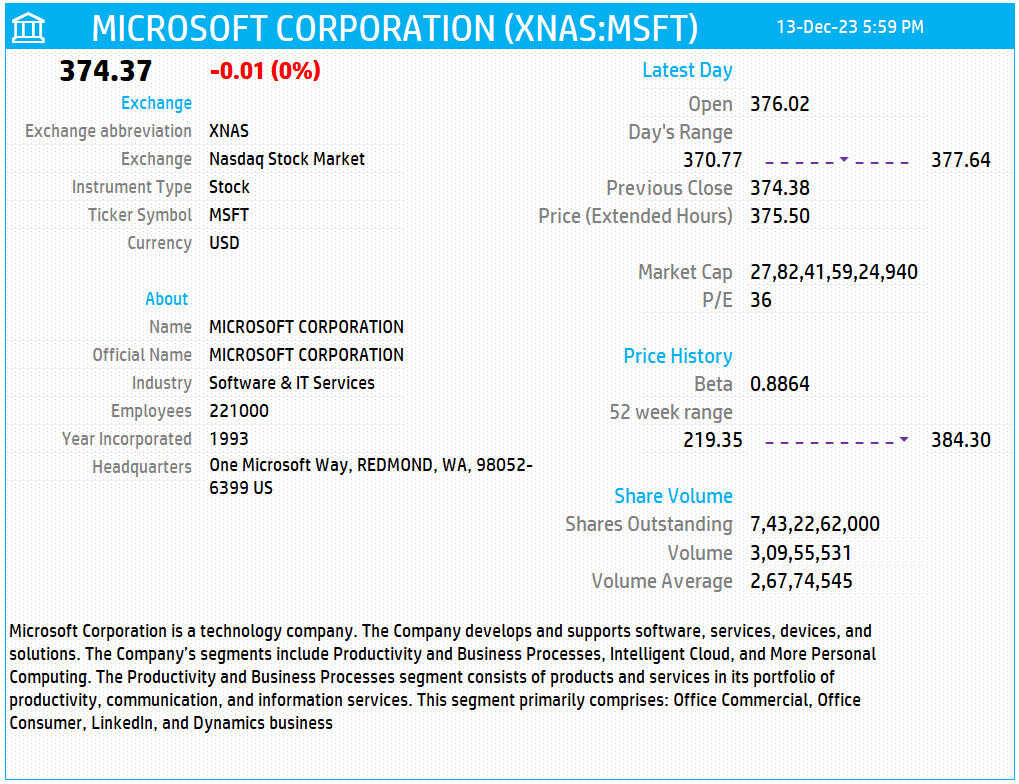
The template shows the information in different sections
- Latest Price and Change in price
- Details of the exchange and the Currency
- About the Company
- Latest day Price range
- Market Cap and P/E
- Price history in the 52 weeks
- Shares outstanding and trade volume
- Time that the data represents
- I have entered an offset of -7 hours from UTC to arrive at pacific time where I live.
- Please use this link (savvytime.com) if you need to know how many hours ahead or behind. If you are ahead, enter positive number. If behind enter negative number.
You can change the Ticker symbol and immediately view the information for a stock.
Now, let’s learn about how this template was built.
The foundation of this is the Stocks Data type.
About Stocks Data type in Excel
With the ‘Stocks’ Data Type, Excel has introduced a new way to bring additional data into Excel via a service.
Let’s type a symbol in a new sheet. You can type any symbol in any cell and then convert to stock data type.
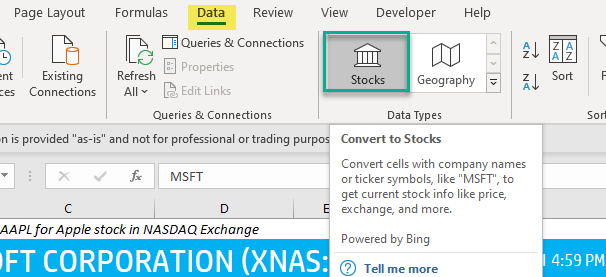
If the symbol is not unique, Excel will offer the choices. For example, MSFT. Select accordingly.
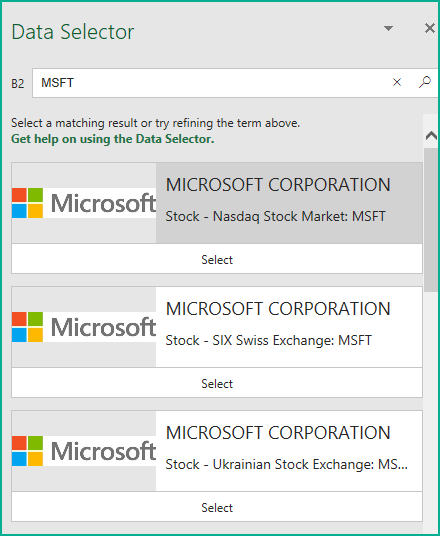
As an alternative, you can type the exchange in front of the ticker with a colon in between, like XNAS:MSFT
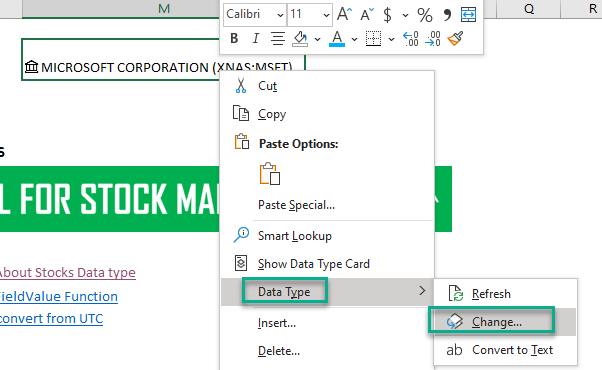
If Excel is picking the wrong value automatically, you can Change Data type to modify the associated stock.
After converting to data type, Right click and choose ‘Show Data Type Card’.
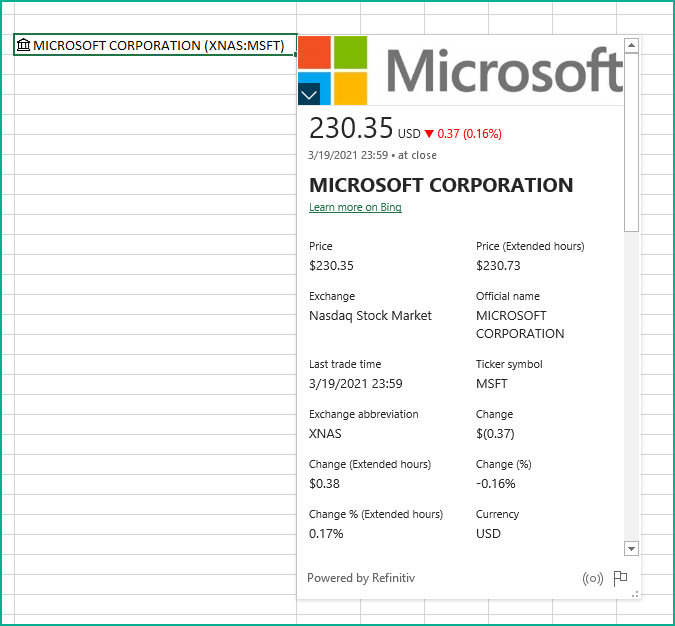
Now this is all the information that is available. What we are doing in our template is to make this more customizable in layout and presentation.
In addition to individual Stocks, you can get data about Indices and Currency exchange data as well.
Here is the link to the article from Microsoft which shows which exchanges are available and the delay in data refresh for each.
Formulas
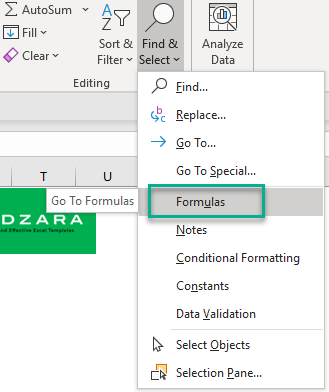
To see all the cells where we have used formulas, in the Editing section of the Home ribbon, Find —-> Formulas
There are two different methods we have shown here on how to pull all the rich stock data into Excel.
- Dot formulas
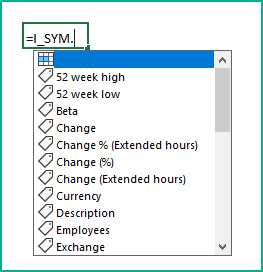
- To pull the latest price, we have used this dot formula.
- I_SYM is the name of the cell where we receive the input ticker symbol.
- You can type a dot and then choose which field you need to extract. Very straight forward.

- FieldValue function
- The second method which I have used a lot in this template is the FieldValue function.
- We provide two inputs to this function. Value – which is our ticker symbol and the field name is any of the field names available with the data type. In this case, I am pointing to this ‘Exchange Abbreviation’ text.
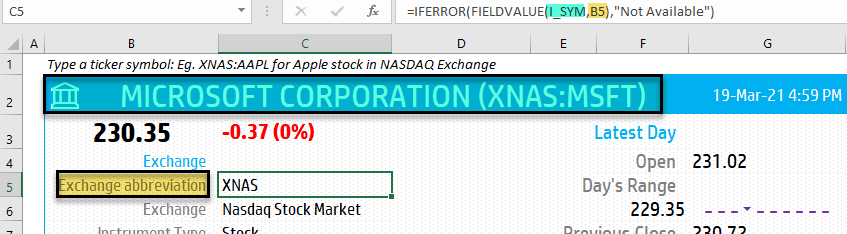
- I prefer this because this is dynamic based on a cell reference. For example, I can type in Employees instead of Year incorporated, to have employees show up in the cell above.
- To accommodate any missing data, we wrap it with an IFERROR function.
To see all the fields available, you can do the dot formula or see the ‘Show Data Type Card’ as explained earlier.
This field list will likely change over time and also may differ by country. I am not sure. Please share your experience on if you see more fields or if you don’t see these fields I am seeing. Please mention the country and exchange you use, in the comments below.
How to refresh?
To refresh the price and other information, just use the regular Excel refresh in the Data ribbon.

Issues
- There is no complete list of symbols that I could find. If anyone does, please let me know.
- Not all the stocks or indices seem to be available even within the exchanges Microsoft says is available. Index data is available for some not for all. I can find S&P500 Index but not Russell 2000 for example.
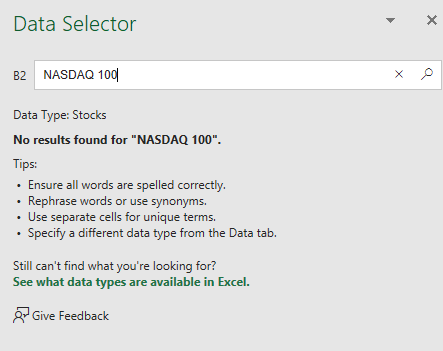
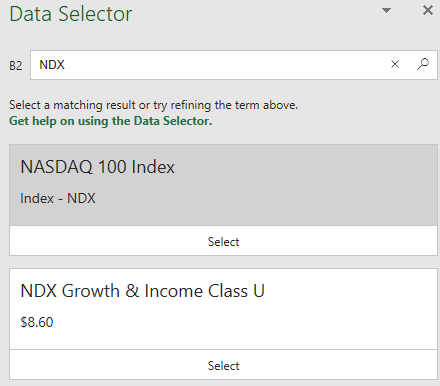
- Search is not very consistent and we have to use codes in a specific way to make it recognize. For example, searching for NASDAQ 100 didn’t work.

- However, if we knew the NDX code, we would be able to find the Index as shown below.

- Dividend data is not available for stocks
- Commodities/Futures do not seem to be available at this time. Hopefully they will be enhancing it soon in the future.
Requirements
Microsoft has introduced a new feature in Excel called Data types. One of the data types is ‘Stocks’. That’s what we will be using for these templates.
This feature is available in Microsoft 365 plans and also in the free Excel for the Web. I will provide links to both.
For all the templates in this ‘Excel for Stock Market’ series, please visit indzara.com/stock-market-templates
-
 SMA Strategy Backtester Google Sheets Template$25
 -
SMA Strategy Backtester Excel Template$25
-
RSI Strategy Backtester Google Sheets Template$25
-
RSI Strategy Backtester Excel Template$25
-
MACD Strategy Backtester Google Sheets Template$25
-
MACD Strategy Backtester Excel Template$25
-
 Simple Moving Average Stock Screener Google Sheet Template$25
 -
Stock Screener Excel Template$97
-
Simple Moving Average Stock Screener Excel Template$25


Feedback
Please share your experience. I expect this to be different with different exchanges and countries. Is it working for you? Is it working differently? I would love to hear from you.