Gantt Chart Maker Excel Template – Support
Support information related to Gantt Chart Maker Excel Template will be posted here. Please post any of your questions on this product in the comments below. I will respond as soon as I can.
Thank you,
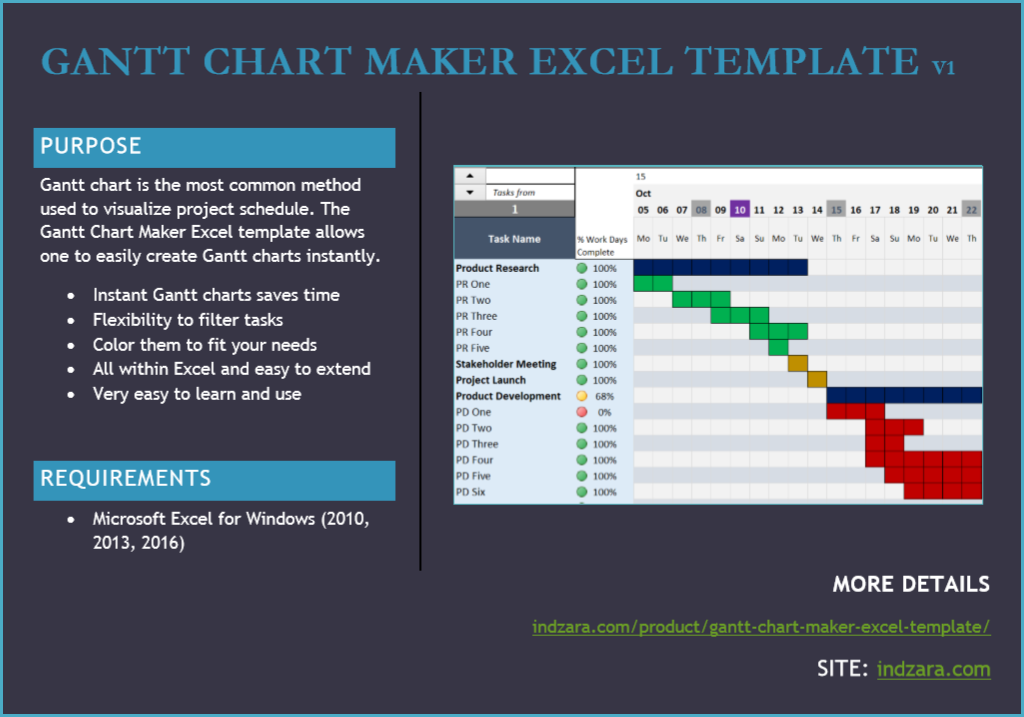
BROCHURE
Download Gantt Chart Maker brochure
VIDEO DEMO
SUPPORT ARTICLES
- How to implement predecessors in Gantt Chart Maker?
- How to extend limits of Gantt Chart Maker? – Expand tasks and time periods displayed, Increase support for beyond 100 tasks.
- Coming soon
- How to print/ export to PDF/PowerPoint
- How to change date
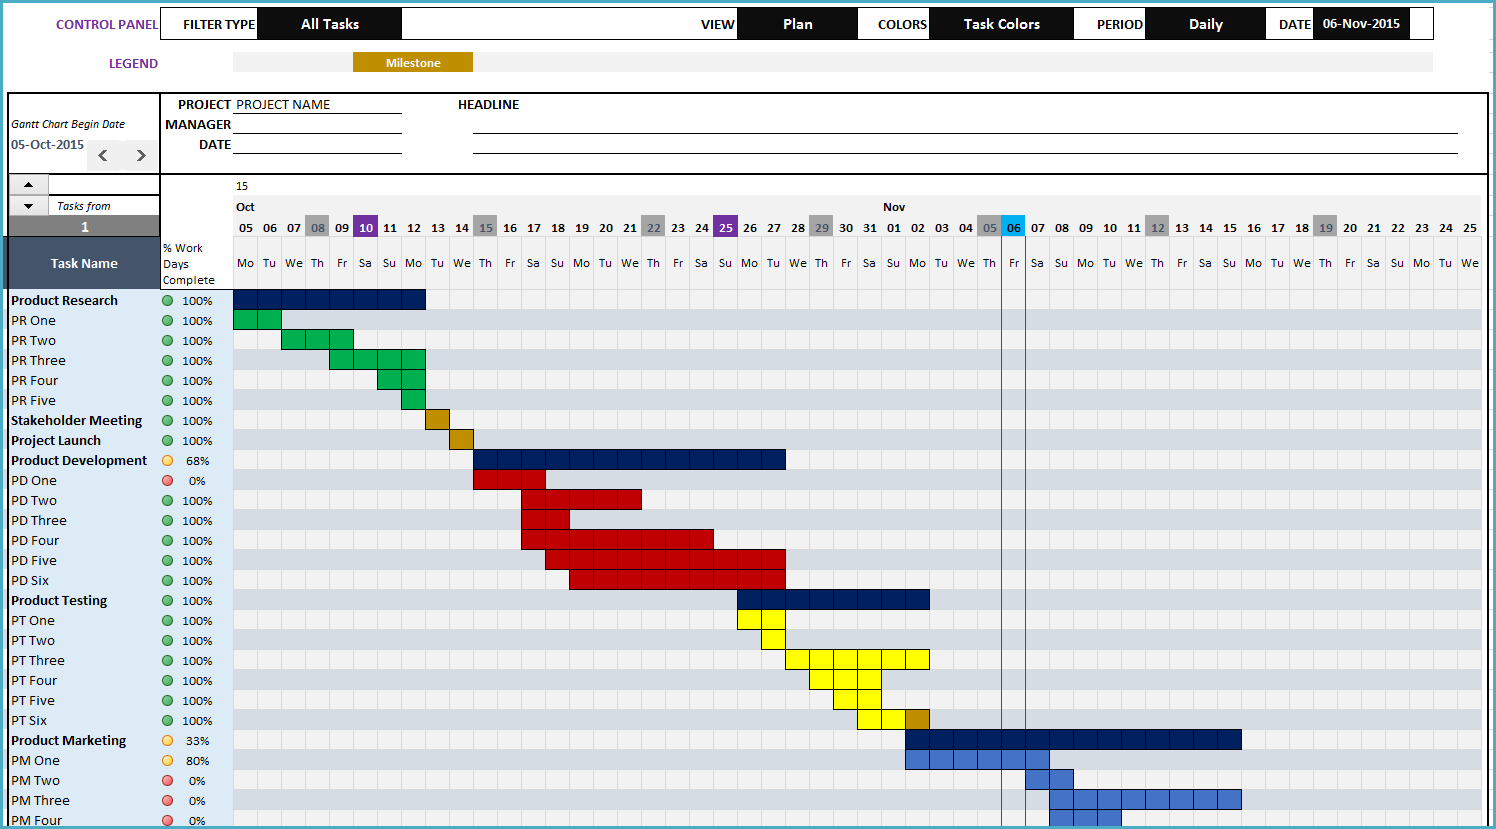
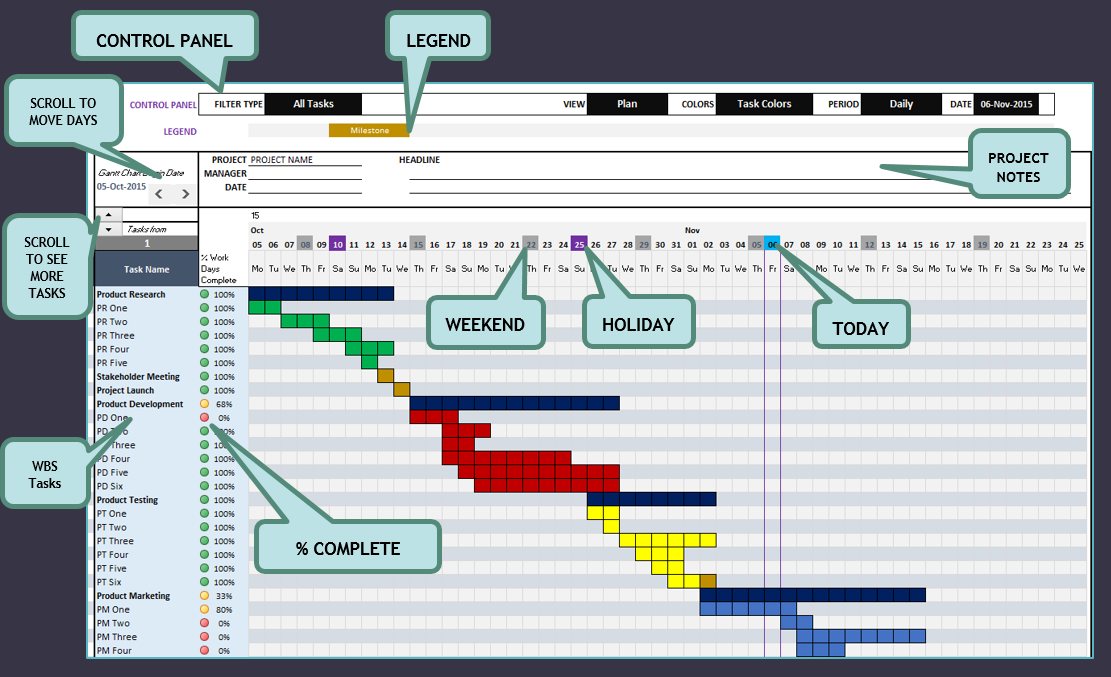
SCREENSHOTS


29 Comments
Also, how do I get a Milestone event to show up in the Gantt Chart?
Hi. Some questions about the Gantt Chart Maker template:
1) Data Entry tab: After I enter Plan Start and Duration, but I start later than planned, do I add duration change and Actual Start Date?
2) Gantt Chart tab: when I filter to Actual vs Plan, what would red boxes mean versus green boxes in the time line?
Thank you for purchasing the template.
1. You need to enter actual start date. The duration change needs to be entered only when your planned duration is changes. For example you planned for 10 days work but it took 12 days to complete, you will enter 12 in duration change.
2. Red box refers to the difference between the plan vs actual. The planned duration from the planned date will be marked with black border. The Green shows the actual worked days.
3. Regarding Milestone event – You will enter each milestone event as separate task and track the same in the Gantt chart.
Best wishes.
Hello, How do I use the % Work Complete column – what does this speak to if its not the dates?
There are two metrics here where one of them could be chosen to be displayed on the Gantt Chart.
1. % of Work Days Complete: If the task is scheduled for 10 work days and 6 work days have already gone by, 60% is % of work days complete. This can be automatically calculated by template and displayed on Gantt Chart. This assumes that work is uniformly distributed.
2. % of Work Complete. This is provided as a user input. Assuming work is not uniformly distributed, you can have 30% of work completed after 6 working days. or you may have 80% of work completed after 6 working days. This allows the user to input this information and control. This can also be displayed in the Gantt Chart.
Please let me know if this helps.
Best wishes.
thank you so much this does help!
I do have another question: On the Timeline page, My task’s names are quite long and I can’t seem to adjust the column heading on anything on the Timeline tab. Also can’t click on them and see the full name. Is there a way to adjust the Column headers so that all my words aren’t cut off? TIA!
You are welcome.
Please unprotect the sheet with indzara as password. Then, you can adjust the column headers.
Please confirm if this solves your need.
Best wishes.
Hello Support,
Found it and works well.
Henk