
Gantt Chart Maker Excel Template – Support
Support information related to Gantt Chart Maker Excel Template will be posted here. Please post any of your questions on this product in the comments below. I will respond as soon as I can.
Thank you,
BROCHURE
Download Gantt Chart Maker brochure
VIDEO DEMO
SUPPORT ARTICLES
- How to implement predecessors in Gantt Chart Maker?
- How to extend limits of Gantt Chart Maker? – Expand tasks and time periods displayed, Increase support for beyond 100 tasks.
- Coming soon
- How to print/ export to PDF/PowerPoint
- How to change date
SCREENSHOTS
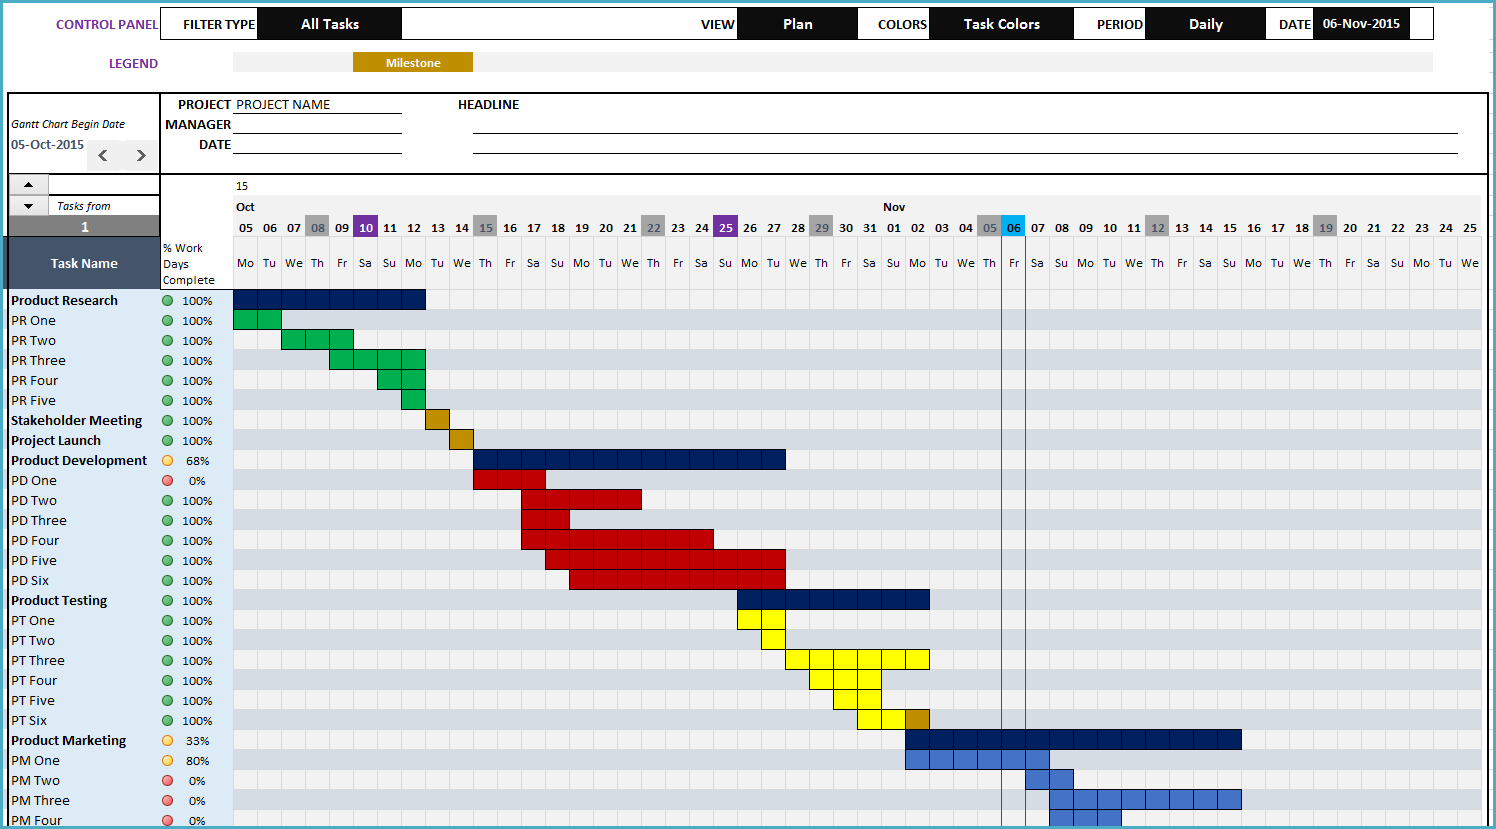
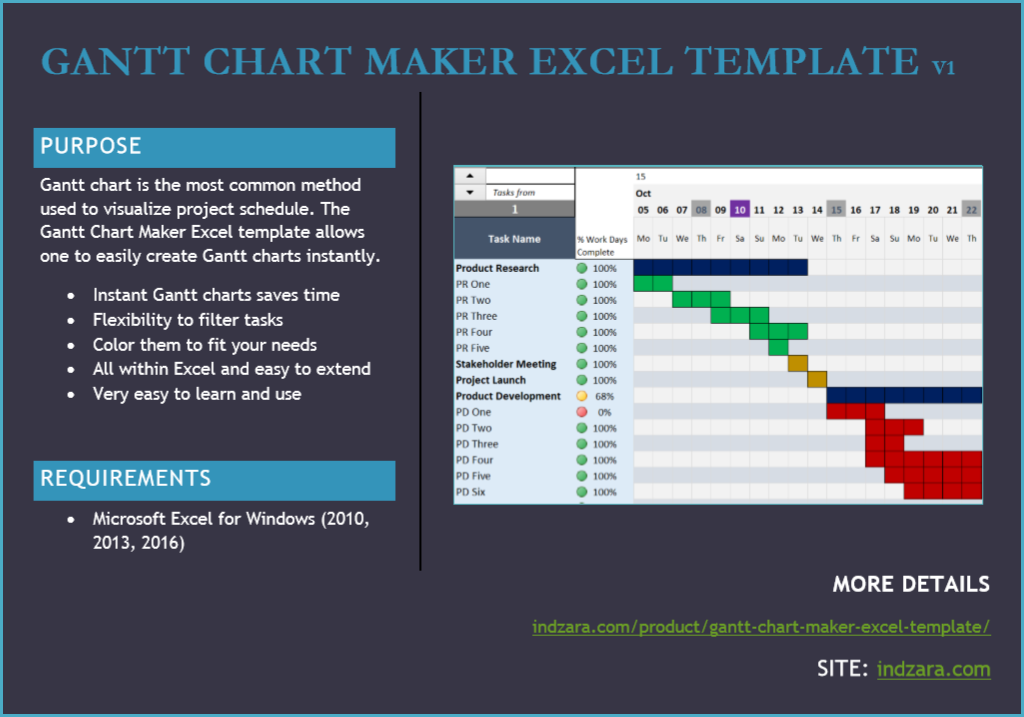
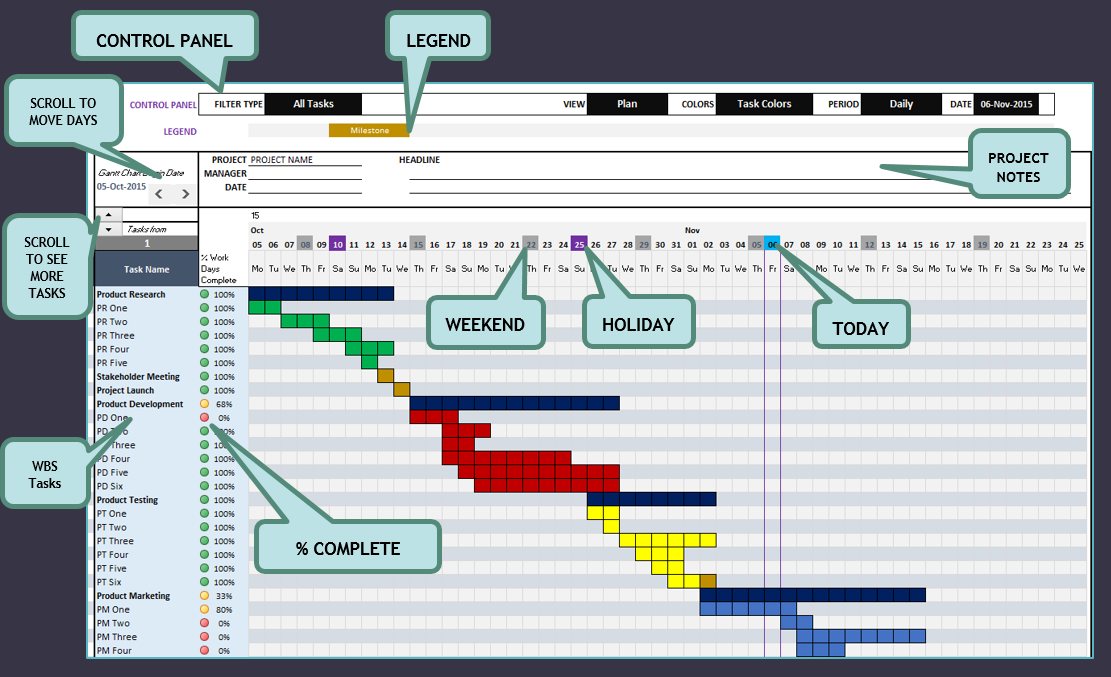
29 Comments
Also, how do I get a Milestone event to show up in the Gantt Chart?
Hi. Some questions about the Gantt Chart Maker template:
1) Data Entry tab: After I enter Plan Start and Duration, but I start later than planned, do I add duration change and Actual Start Date?
2) Gantt Chart tab: when I filter to Actual vs Plan, what would red boxes mean versus green boxes in the time line?
Thank you for purchasing the template.
1. You need to enter actual start date. The duration change needs to be entered only when your planned duration is changes. For example you planned for 10 days work but it took 12 days to complete, you will enter 12 in duration change.
2. Red box refers to the difference between the plan vs actual. The planned duration from the planned date will be marked with black border. The Green shows the actual worked days.
3. Regarding Milestone event – You will enter each milestone event as separate task and track the same in the Gantt chart.
Best wishes.
Hello, How do I use the % Work Complete column – what does this speak to if its not the dates?
There are two metrics here where one of them could be chosen to be displayed on the Gantt Chart.
1. % of Work Days Complete: If the task is scheduled for 10 work days and 6 work days have already gone by, 60% is % of work days complete. This can be automatically calculated by template and displayed on Gantt Chart. This assumes that work is uniformly distributed.
2. % of Work Complete. This is provided as a user input. Assuming work is not uniformly distributed, you can have 30% of work completed after 6 working days. or you may have 80% of work completed after 6 working days. This allows the user to input this information and control. This can also be displayed in the Gantt Chart.
Please let me know if this helps.
Best wishes.
thank you so much this does help!
I do have another question: On the Timeline page, My task’s names are quite long and I can’t seem to adjust the column heading on anything on the Timeline tab. Also can’t click on them and see the full name. Is there a way to adjust the Column headers so that all my words aren’t cut off? TIA!
You are welcome.
Please unprotect the sheet with indzara as password. Then, you can adjust the column headers.
Please confirm if this solves your need.
Best wishes.
Hello Support,
Found it and works well.
Henk
Good morning,
Last week I bought GanttChartMaker_v1.2 from you.
I am very happy with this and it saves me a lot of work and time.
Now I have the following question:
On the DATA_ENTRY tab, I enter all my tasks names.
They return to the GANTT tab. Now I have to scroll each time with the buttons to see everything.
Can I expand the number of lines so that I can see everything at once?
Which setting (Range ??) do I have to adjust for this?
If necessary, I can send screenshots.
Thanks for the support.
Henk
Hello,
Before ordering, curious on a few things:
– option for no weekends?
– ability to adjust colors, for tasks etc.? (good for company presentations, matching corporate colors etc.)
– change Period to Quarterly in the gantt? I see the option for daily, monthly, yearly.
Thanks
Mike
Thanks for your interest.
1. Yes, the template can now support ‘no weekends’. If you select none of the values in Weekends, then all days will be considered as working days.
2. To change colors, you have to edit the conditional formatting rules and formulas (if you need to rename the colors as well). The template can be edited by the user as password will be provided to unprotect.
3. Changing period to Quarterly would require some development. Formulas have to be modified. It is not one of the options. We will plan to include this in the future version.
Please let us know if there are further questions. Best wishes.
hi there, thanks for the template – its GREAT!! I just have one little problem where the table stops auto populating the data entry tab columns M and N after 100 lines of tasks are entered. I have thought I had somehow broken the template so I started again from scratch and same problem at row number 111. How can I make the table auto populate after 100 lines of tasks are entered?
Hello
Thank you for your feedback.
Please see this article on how to extend the number of tasks: https://indzara.com/2017/07/extend-limits-tasks-time-periods-gantt-chart-maker/
I have sent you a separate email on this subject as well.
Please let us know if there are any questions.
Best wishes.
I work with an events company and we technically don’t have “weekends”. Is there a way to put a “zero” value in the weekends section so that the calculated end dates don’t skip days of the week? For example, we have an event happening on a Saturday and Sunday, and there is no way for me to show work being started and completed on those days. Thanks!
Thanks for purchasing.
I have emailed you a version that allows for ‘no weekends’. Soon this feature will be incorporated in the product download.
Please let me know if there are any questions.
Best wishes.
Hi, love this. I can see we can ‘extend’ the number of increments beyond 52, and can see e.g a task in Week 60 by scrolling with the left-right buttons.
But is it possible to extend the gantt sheet so all tasks in weeks 1-60 would show on the screen, rather than having to scroll and just see tasks in weeks 8-60?
Thanks
Thanks for purchasing. Glad to hear that you like it.
To extend number of tasks shown on Gantt chart, copy Row 54. Select extra 10 rows and Insert copied cells.
To extend number of periods shown on Gantt chart, Unhide all columns. Copy column BL. Select extra 10 columns and Insert copied cells.
Check conditional formatting rules
Check print preview settings
Please let me know if there are any questions.
Best wishes.
Thank you for the very prompt reply – this did the trick!
You are very welcome. Glad to hear.
I have also posted a video and tutorial on how to extend the limits https://indzara.com/2017/07/extend-limits-tasks-time-periods-gantt-chart-maker/
Best wishes.
I can’t get my Gantt to populate – help can I send you my file – I have items in the data entry table but they dont show anywhere…
Thanks
Ross
Thanks for purchasing.
Thanks for sending the file. Please start entering data from row 11. Once row 11 is entered, enter data in cell A12. Now, row 12 will become part of the table. For tips on data entry in Excel tables, I have written an article. https://indzara.com/faq-items/introduction-excel-tables-data-entry/
If you are pasting data from some other file, please paste as values. Just pasting will replace the drop down functionality.
I have emailed you a file with data correctly entered.
Please let me know if there are any questions.
Best wishes.
Is there anyway to change the weekly view so the week date corresponds with Monday instead of Wednesday? Right now I’m working through a plan that shows May 3, 10, 17, 24 & 31 and I want it to show the week starting date.
The weekly view is designed to show the week end dates. However, you can change the Gantt Chart Begin Date to move it to any day of the week. If the Gantt chart begin date is set to be a Tuesday, then each week (tue-mon) ending date will be Monday. Please try this and let me know if there are any questions. Best wishes.
I have loaded the Gantt Chart maker and have completed the “settings” and “data_entry” tabs. However, no data is appearing in the GANTT tab or in columns M, N and O on the DATA_ENTRY. I have watched the tutorial again paying close attention to the settings, but I cannot figure out how to get the gantt chart information to load.
On the GANTT, I am using the following on the Control Panel Section: All, Plan, Resource Color and Daily. Also, I have checked the date ranges throughout the spreadsheet and they seem to be in line.
Please Help! Thanks!
Thanks. Thanks for sending the file by email. It’s super useful.
Please enter data inside the table in DATA_ENTRY sheet. Start entering from row 11 and then row 12 and then row 13…. For more on entering data in Excel tables, please see https://indzara.com/faq-items/introduction-excel-tables-data-entry/
I have corrected and emailed the the file to you.
Best wishes.
I purchased and downloaded your Gantt charting program. I had a quick question, is there a way to calculate the new projected completion date from the entered actual data. If a task is completed earlier or late, this will affect the future ending date. Please advise.
Thanks for purchasing.
You can enter the Actual Start Date if it started on a different date than the Plan Start Date. Then, if the expected duration changes, enter in the ‘Actual – Duration Change’ field. Then the template calculates the Actual End Date and displays in GANTT sheet.
Please let me know if I have not addressed your question.
Best wishes.
I have just downloaded my first template and I have watched the video. I wish to work with a weekly scenario and our non working weekends are Saturday and Sunday. I have entered these details successfully. However I would like the weeks to start on Mondays whereas the chart seems to start with Saturdays. How can I alter this?
Thanks for downloading.
The Gantt chart Begin date can be modified. By default it is set to the Project Start Date that you enter in the ‘Data Entry’ sheet. But you can change that by using the arrows at the top left of the Gantt chart. This allows us to scroll through dates.
In the Weekly Gantt scenario, if we pick a date that falls on a Monday as Begin Date, then we will see Sundays shown on the Gantt chart. This is because week end dates are shown on Gantt.
Please let me know if there are any questions. I will also email this information to you.
Thanks & Best wishes.