2024 Inventory and Sales Manager Excel Template
This Inventory and Sales Manager Excel template is suited for managing inventory and sales if you are running a small business of buying products from suppliers and selling to customers. (Retail/Wholesale).
This retail inventory excel template will assist in knowing the inventory levels of each product and understanding which products to re-order. Also, you can quickly view the purchases/sales patterns over time and the best-performing products.
This Excel template is designed for Microsoft Excel, but if you are looking for a Google Sheet template, please visit Inventory and Sales Manager in Google Sheets.
A new version is available with additional features such as auto-price population. The new template has automatic price population on order line items which this one doesn’t. There are some users who do not want to auto-populate the prices as they want flexibility to change prices for different customers. For those, the template on this page would be more useful. Hence, we have retained both templates on our site.
Retail inventory Tracker (Free)

FEATURES
- Enter and manage up to 2000 different Products
- Set custom re-order points for each product
- Simple and Easy data entry
- Know current inventory levels of each product
- Identify the products to be re-ordered
- Know if the sale orders can be fulfilled
- Easily understand the sales and purchase patterns (monthly and cumulative)
- Quickly see your top customers and suppliers
- Identify your best performing products
- Know how the different product categories contribute to sales
- Easily retrieve and view your order details
Free Excel inventory template with formulas
This template is developed using only formulas and does not have any macros or code. Formulas are used to calculate inventory and sales. You can view the formulas in the sheet and can edit them if needed. We recommend not editing any formulas unless you are very sure about the changes and the impact on functionality.
DOWNLOADS
REQUIREMENTS
Windows and Excel 2010 (or above version)
Mac and Excel 2011 (or above version)
VIDEO DEMO
HOW TO USE THE TEMPLATE
Enter Products
Enter list of products and re-order points in the Products worksheet

Product Category: This allows you to categorize products. If you have numerous products, categorizing similar products together can help in understanding product performance.
Re-order Point: Amount that you set for each product, where when the current inventory level hits that amount, you will place a new purchase order to replenish inventory. (For more, read Re-Order Point Article in Wikipedia)
Enter Orders
Enter the line items for all the orders (both purchase and sale) in the Orders_and_Inventory worksheet

If you have any existing inventory when you start using the template, enter them first. You can then continue to enter your new orders (purchase and sales) as they happen. The template will then give you accurate count of your inventory.
- Order Number: This Order number is not used in the template to calculate anything. This has been provided for you to track your orders easily. You can filter the Orders table by choosing specific order number to see all the items in that order. If your systems generate any order numbers, you can enter them here. If you don’t have any such systems, you can create your own. The only recommendation is that you should have a unique order number for each order.
- Order Type: There are two types of Orders: Purchase and Sale. When you place an order to acquire products from suppliers, it is called a Purchase order. When your customer places an order to buy products from you, it is called a Sale.
- Order Date: For Purchase orders, this is the date when the order is placed by you to your supplier. For Sale orders, this is the date when the order is placed by your customer to you.
- Expected Date: For Purchase orders, this is the date when the inventory becomes available for you to sell. For Sale orders, this is the date when the inventory will leave you to the customer.
- Partner: For Purchase orders, your supplier is the Partner. For Sale orders your customer is the Partner.
- Quantity: Number of units of products. The unit can be any numeric value. Even if your unit is not whole numbers, you can still use the Quantity field.
- Unit Price: In Purchase orders, this is the cost of buying one unit of the product. In Sale orders, this is the revenue from selling one unit of the product.
- Amount (Calculated field): (Unit Price X Quantity) = represents the amount of money. In Purchase orders this would be money leaving you and in Sale orders, this would be money that customers pay you.
- Inventory Availability (Calculated field): This is the quantity (number of items) of the product available in inventory as of the Expected Date.
View information about overall inventory availability
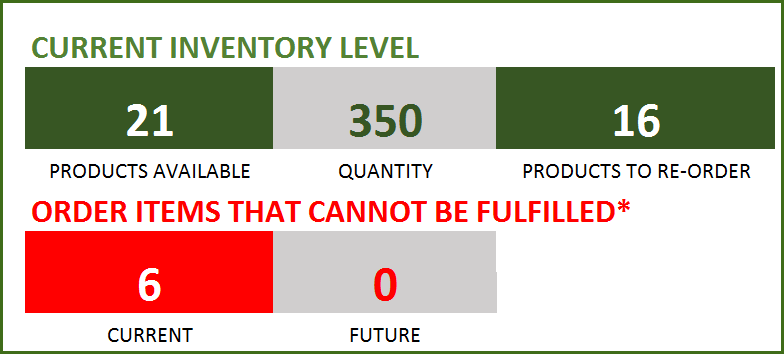
Inventory Spreadsheet Excel Template – Summary Metrics
- Current Inventory of a product = (Total Purchases of Product – Total Sales of Product) as of today
- Products Available: Number of Products where the current inventory level is greater than 0.
- Quantity: Total Number of items of all Products currently available
- Products to Re-order: Number of Products where the current inventory is less than or equal to the re-order point
- Order Items that cannot be fulfilled (Current): Among the orders where the fulfillment date is less than or equal to today, number of line items in orders where the available inventory is less than the Sale quantity
- Order Items that cannot be fulfilled (Future): Among the orders where the fulfillment date is in the future, number of line items in orders where the available inventory is less than the Sale quantity
View details of one specific product
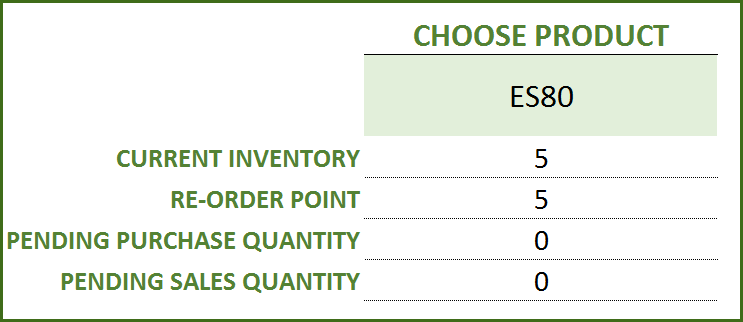
Choose a product from the drop down and see details of that specific product.

Choose Product to view current inventory
- Pending Purchase Quantity: Quantity in the Purchase Orders that are expected to be available in the future
- Pending Sale Quantity: Quantity in the Sale Orders that are expected to be delivered in the future
View products to re-order

If there are line items that cannot be fulfilled or if there are products to re-order, take actions appropriately
View Report
View the Report worksheet to understand the purchase/sales trends and also to identify the top performing products and most valuable suppliers/customers.
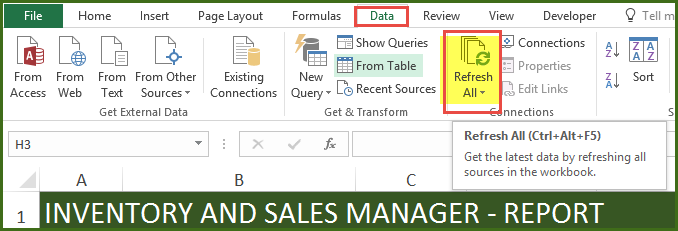
Since there are pivot tables and charts, please refresh the data by pressing Ctrl+Alt+F5 or going to DATA ribbon and selecting Refresh All. This updates the charts with your new transactions.

The report sheet has slicers (filters) at the top.

Amount and Cumulative Amount by Month

Quantity and Cumulative Quantity by Month

Amount distributed across Product Categories by Month

Quantity distributed across Product Categories by Month

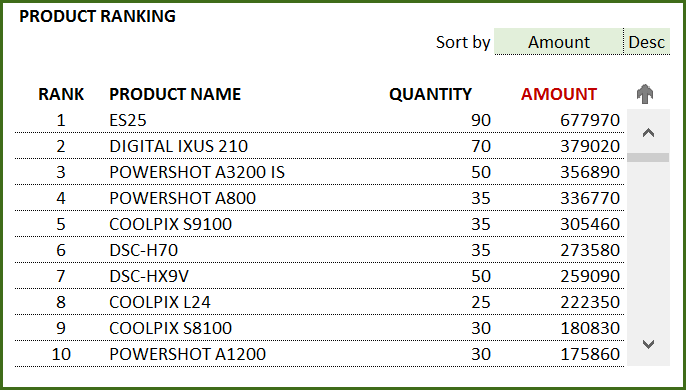
Product Ranking based on Sales Amount or Quantity

If you find the template useful, please share it with others. If you have any feedback, please share it in the comments below.
RELATED FREE TEMPLATES
Manufacturing Inventory Tracker Excel Template (Free)
Rental Inventory Tracker Excel Template (Free)
RECOMMENDED PREMIUM RETAIL INVENTORY TEMPLATES
-
Product on sale
 Retail Business Manager – Excel TemplateOriginal price was: $50.$40Current price is: $40.
 -
 Retail Business Manager (Pro) – Excel Template (Multiple Locations)$50
 -
Product on sale
 Retail Business Manager – Google Sheet TemplateOriginal price was: $50.$40Current price is: $40.

578 Comments
thank you indzara and thanks to all the team working on this amazing templates.You are the best
You are very welcome. Thanks for the feedback. Currently, I am the ‘team’. 🙂 Best wishes.
hello. why unit price cannot insert cent . for example 7.50 , 7.42 . only work if i put 7.00 . its because vat 6% with the cost of item.
It should work with decimal values. I just tested and it works fine. Please check the cell format. If there are further issues, please email file to indzara@gmail.com. Thanks & Best wishes.
Please help me out why it is restricted?
It is restricted to product names entered in the Products table, to help with clean data entry. Please check if the product names are entered in the Products table. Thanks & Best wishes.
Hello! I would like to try out your file also for our small start-up, hope you can share it to us as well 🙂
Thanks for the interest. Are you not able to download the file from the ‘Download’ Button above? I tested just now and it seems to work fine. If you have any pop-up blockers in the browser, please try without them or try another browser. Please let me know. Thanks. Best wishes.
Hello
Dunno why, but im not able to download the template. The download button isnt linked.
Tested with ff and crome. Anybody knows help?
thanks you
I am sorry about the inconvenience. The site is undergoing some maintenance work. I have emailed the file to you. Thanks.
Thank you so much 🙂
You are welcome. Best wishes.
Hello IndZara..
It is very generous and kind of you to distribute free templates that will help small and very small businesses that can’t afford commercial software to get a start.. thank you
Thank you for the kind words. I am glad that the templates can be useful. Best wishes for your business.
hi
first of all thanks for your great sheet. it helped me alot, but i have a question.
i want to make a tab purchase and a tab sale. if i try to make that and i set a line in purchase in one tab then set a line sale in other tab. the current inventory won’t change on the tab sale.
is there any solutions for.
thanks.
You are welcome. The template is designed with keeping all orders (purchase and sale) together in one sheet. This allows calculations to be simplified. Having separate sheets will not work in this template. A complete rebuilding of the workbook is needed for that framework. I don’t have any such template now. I am very sorry.
Please let me know if there are any questions.
Thanks & Best wishes.
Hi, I just downloaded the spreadsheet and for some reason the Inventory availability column doesn’t quite work. I see it should deduct when it says “sales” and add when it says “purchase” but it doesn’t work consistently. Even on your sample data worksheet it shows a little off. If you bring up just ES25 products then look in the inventory availability. It says 90 then quantity purchased 40 but it still says 90 for availability. My problem is similar except it is deducting an extra 10. Then a few lines down it is adding instead of subtracting. Thoughts?
thanks.
You are correct. It will add all purchases and subtract sales for that product as of the Expected date of that line. In the example of ES25, there are two rows with same expected date Oct 12th of of units 40 and 50. So, the inventory availability as of Oct 12th will be 90 (50 + 40). As we go further down, we have 2 Sale order lines and the inventory availability decreases from 90 to 85 and then to 35. Hope this helps clarify. Please let me know if there are further questions. Thanks & Best wishes.
Hi Indzara, thank you for your quick response.
I saw form your sample that Purchase’s Expected Date (PED) later than Sale’s Expected Date (SED) while Inventory Availability (IA) < 0 (please check DSC-HX7V and DSC-HX9V). This is not common. You have to fulfill the requirement before the SED. While you correct the PED so PED<SED then you will see that the IA is not applicable. Can you fix it?
You are welcome.
I am not really sure about your question. If I am not addressing it correctly below, please clarify.
For any row with SALE order type, we calculate how much inventory of that product is available as of Expected Date of that SALE order. That is shown as Inventory Availability. If that is negative, it means we don’t have enough to fulfill that order line item. It is colored with red fill and red border.
Let’s take an example purchase order for 5 units of product A with expected date of Jan 5th. Let’s take an example sale order for 5 units of product A with expected date of Jan 10th. If your purchase order’s expected date is earlier than Sale Order’s expected date, that means you will receive inventory in time to fulfill the sale order.
In the sample data file, for product DSC-HX7V, both sale orders cannot be fulfilled due to shortage of inventory. Purchase Order P5 arrives only on Sep 9th, much later than the Sale orders’ expected dates.
Hope that clarifies. Thanks.
PLEASE PLEASE PLEASE HELP
I have sent an e-mail to you. Please respond to the e-mail and I will do my best to help. Thanks.