
Changing the Colour Gradient in the Heat map
I have received requests around how to change the colour gradient for the Geographic Heat Map (India) Excel template. In this quick tutorial, I will explain how to do it.
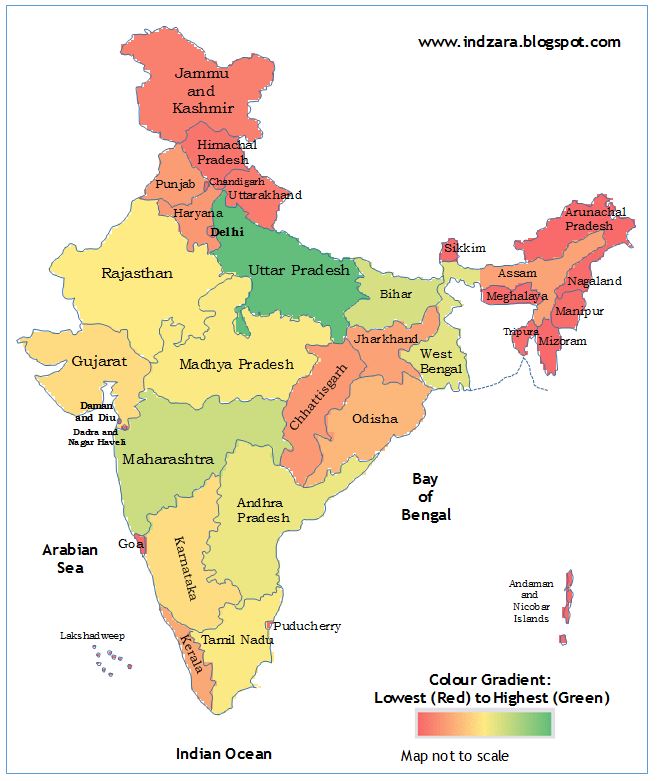
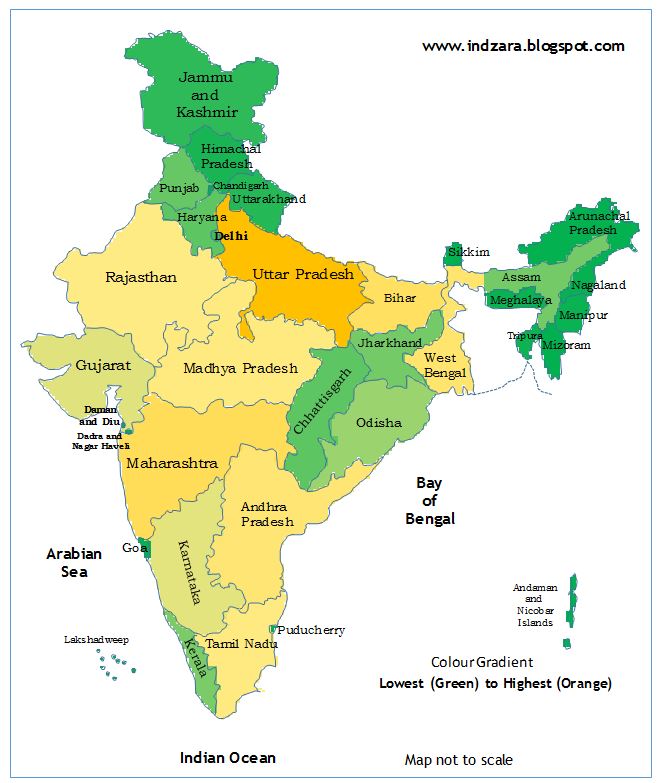
Step 1: Download and open the Geographic Heat Map (India) Excel Template. The map looks like the image below.
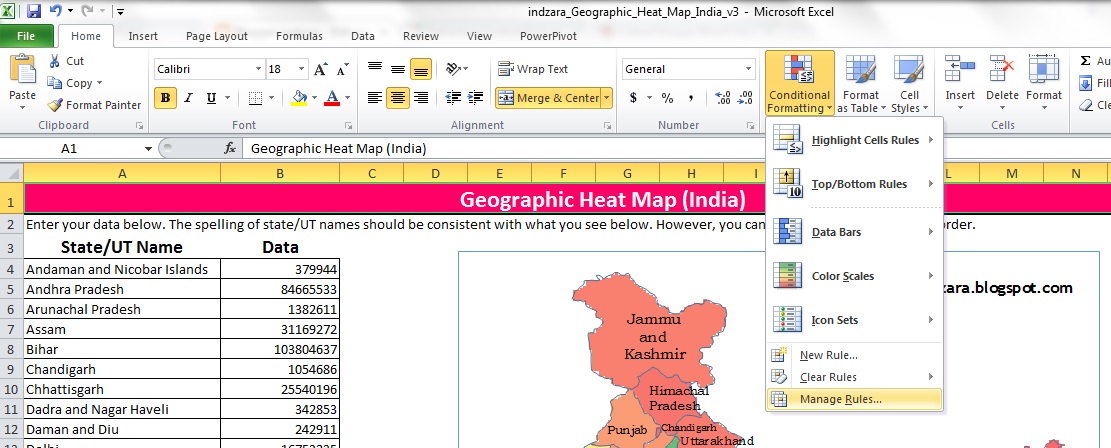
Step 2: Open Conditional Formatting menu and choose Manage Rules
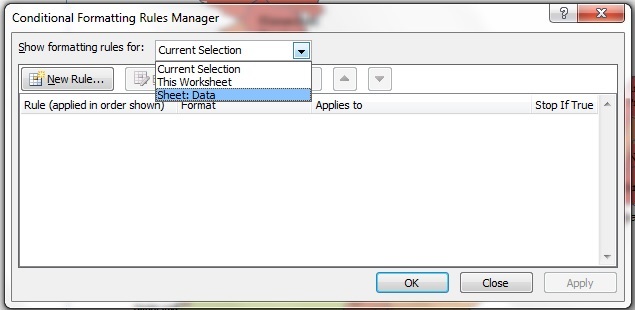
Step 3: Choose Sheet: Data
Step 4: Click Edit Rule
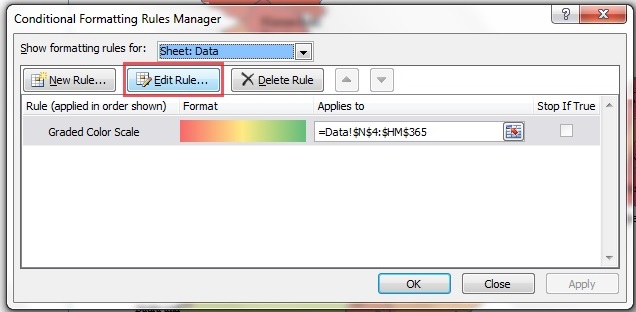
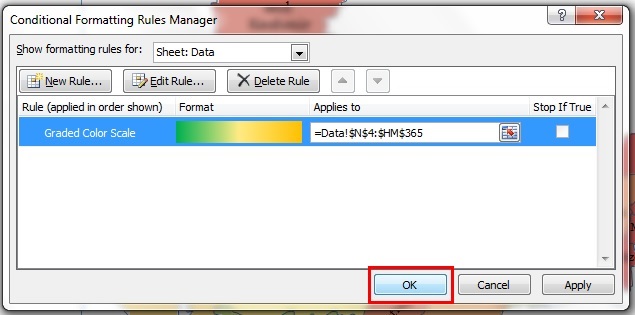
Step 5: You should see the existing conditional formatting rule as shown below
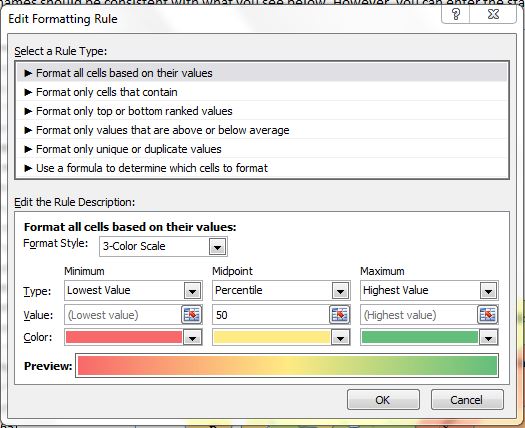
Step 6: Change the colour for the minimum to your choice. This is the color that will be applied to the states with the lowest numbers in your data.
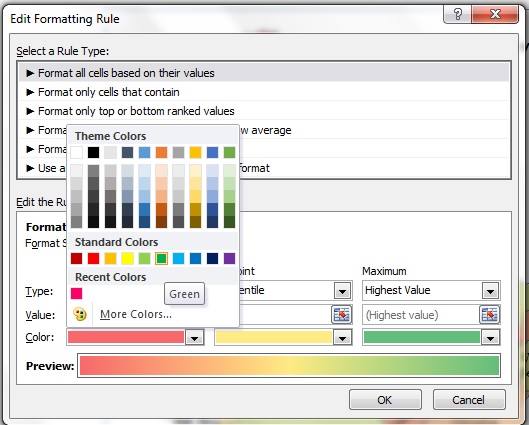
Step 7: Change the colour for the maximum to your choice. This is the colour that will be applied to the states with the highest numbers in your data.
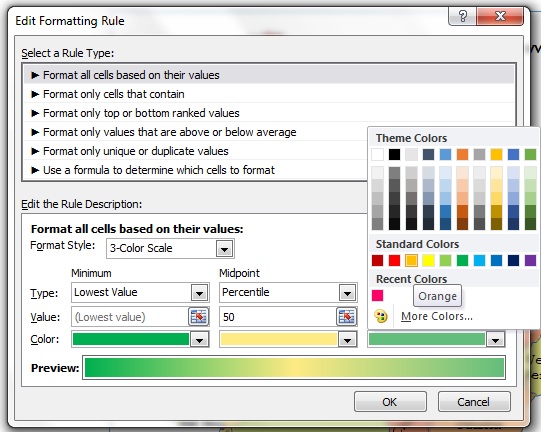
Step 8: Click OK
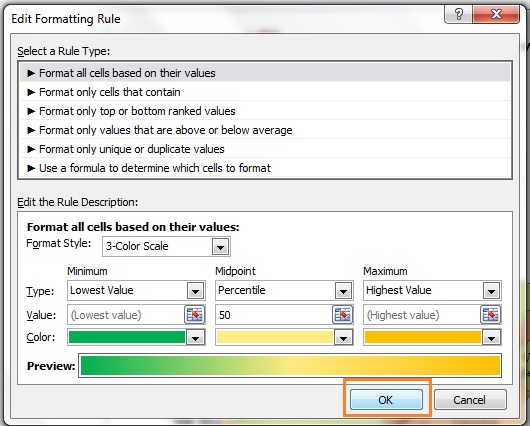
Step 9: Click OK in the next dialog box.
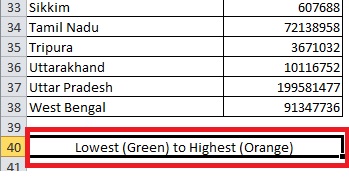
Step 10: Back in the Geographic_Heat_Map worksheet, scroll down to row 40. Edit the text to reflect the colours you changed now. (You can enter any text here as you prefer.) This will be displayed on the map image so that those who read the map understand the colour gradient used.
Your map image will update automatically.
Related free Templates
- Kerala State Heat Map
- Tamil Nadu State Heat Map
- World Heat Map Excel Template
- World Cup Cricket Dashboard
42 Comments
Hi, if we are using this map for commercial purposes, are there any copyright issues? If yes, how to resolve them.
Also, can you add the UT of Ladakh as well? It will be great to have 2 versions, one with Ladakh and one without it.
Regards,
Swapnil
What can I do to bring the values instead of the state names as labels?
Thank you for using our template.
You will have to unhide the hidden tab and need to select the each state name text box and change the mapping from state name to state values. You can also add a new text box to lookup the state’s value along with the state name if required.
Best wishes.
What can I do to bring the values instead of the state names as labels?
Our support team will send you the procedure to display the values instead of state name or together.
In the meantime, if you require any support on our product, requesting you to send an E-Mail to support@indzara.com
Great tool. Fabulous work.
I have one query. Can we change “www.indzara.com” on the map? Is yes, how can this be done?
Thank you. We are glad you find our template useful. Follow the steps given below to change the text.
1. Unhide the sheet Data
2. Edit the text http://www.indzara.com
3. Save the sheet
EXCELLENT !!!!
TREMENDOUS !!!
Thanks!!!
This is excellent support for most of us.
Just facing a small problem—
I tried changing the colour gradient as per your instructions. bu the map did not get updated automatically. What to do?
Hey… I figured it out… Thanks
Welcome!!!
Hi ! Thank you for this absolutely useful map! Is there any way to show the states as white for the states where data is not available?
Thanks
Thanks for using our template.
Please unhide the sheets and you can change the colors.
Best wishes
Thanks. You have explained it so nicely, that one could understand it instantly. You have taken pains to capture screenshots that illustrate how this needs to be done. Wonderful and Awesome. Thanks a lot. Keep up the good work.
Thanks for your positive feedback!!!
Hi, Can I add value also in the respective state also.
Hello
You can change the value as well.
Best wishes
Is there any way that I can reduce the font size of state name in the map?
Please unhide hidden sheet ‘Data’. You can click on the state name boxes there and edit the font size. This would update the map in the first sheet.
Best wishes.
Thanks. Your maps are really amazing.
You are very welcome. Thanks for feedback. Best wishes.
I have enter the text in row 40, colour of the map has changed, but colour gradient at right hand corner did not changed.
Pl let me know , how it can be changed?
Have you replaced the existing gradient text (row 41)? I am sorry if it is not row 40. There have been different versions of the file and it could have changed.
I tried just now (changed row 41) and it updated on the map image.
You can also open the hidden Data sheet where this text block is.
Please let me know if it doesn’t work. Best wishes.
These maps are really helpful!
Can you please tell me how we can add values in the color gradient in the right corner?
Thank you.
Back in the Geographic_Heat_Map worksheet, scroll down to row 40. Edit the text to reflect the colours you changed now. (You can enter any text here as you prefer.) This will be displayed on the map image so that those who read the map understand the colour gradient used.
Please let me know if I have misunderstood your question.
Thanks.
Very good map. It really serve my purpose. Thanks again.
You are very welcome. Thanks for your feedback. Best wishes.
Thank you so much for this, you made me look so good in front of my employer. Was looking for this resource online for a presentation. Note: Will try recreate state level(district-wise) interactive chart for some states and share here when I am free.
You are very welcome. I am glad that I could be of some help.
Please share district level maps when you have them. They will be great. Best wishes.
Are the district level Maps ready. Need them
Hi..
I also wish to know is there a heat map for Regionwise for India ?
Thanks in advance
I am sorry. I have only this map for now.
Its a good source in deed.
I wanna add values on each state?
How to do that ?
Thank you.
You can add text boxes and point them (type = and select the cell where the data is) to each state’s data. I think it has to be manually done for each state.
If you may please look into my requests for district level map and also if we may get multiple colour schemeing not only 3 colour shades, it will be great service to Non profit research organization like us.
Yes, I do plan to publish district level maps in the future. However, it will take some time. Please e-mail me at indzara at gmail so that I can inform you when I have the district level maps. Which state(s) are you interested in?
Its a great tool. Do you plan to go district level as your next project.
Can we have a 4 color scheme in this as well?
Thank you. The current gradient scheme is more flexible. 4 Color Scheme can be set up if needed. Are you familiar with conditional formatting?
V Nice tools, need help in Colour formating. how to implement more then 3 color scheme
Please visit tutorials on ‘conditional formatting’. I have some videos on this topic: https://www.youtube.com/watch?v=jVCEQYzsBL8&index=8&list=PLPA6EhiqturQvJ70FNJ1fFLwGNHtl-YO4
Hope this helps. Best wishes.
Heatmap is a great tool to design a webpage more interactive and creative to capture visitors attention. It do tells the problem area of the webpage which needs to be improved and redesigned. Thanks for sharing with us such a wonderful post.