2024 Inventory and Sales Manager Excel Template
This Inventory and Sales Manager Excel template is suited for managing inventory and sales if you are running a small business of buying products from suppliers and selling to customers. (Retail/Wholesale).
This retail inventory excel template will assist in knowing the inventory levels of each product and understanding which products to re-order. Also, you can quickly view the purchases/sales patterns over time and the best-performing products.
This Excel template is designed for Microsoft Excel, but if you are looking for a Google Sheet template, please visit Inventory and Sales Manager in Google Sheets.
A new version is available with additional features such as auto-price population. The new template has automatic price population on order line items which this one doesn’t. There are some users who do not want to auto-populate the prices as they want flexibility to change prices for different customers. For those, the template on this page would be more useful. Hence, we have retained both templates on our site.
Retail inventory Tracker (Free)
FEATURES
- Enter and manage up to 2000 different Products
- Set custom re-order points for each product
- Simple and Easy data entry
- Know current inventory levels of each product
- Identify the products to be re-ordered
- Know if the sale orders can be fulfilled
- Easily understand the sales and purchase patterns (monthly and cumulative)
- Quickly see your top customers and suppliers
- Identify your best performing products
- Know how the different product categories contribute to sales
- Easily retrieve and view your order details
Free Excel inventory template with formulas
This template is developed using only formulas and does not have any macros or code. Formulas are used to calculate inventory and sales. You can view the formulas in the sheet and can edit them if needed. We recommend not editing any formulas unless you are very sure about the changes and the impact on functionality.
DOWNLOADS
REQUIREMENTS
Windows and Excel 2010 (or above version)
Mac and Excel 2011 (or above version)
VIDEO DEMO
HOW TO USE THE TEMPLATE
Enter Products
Enter list of products and re-order points in the Products worksheet
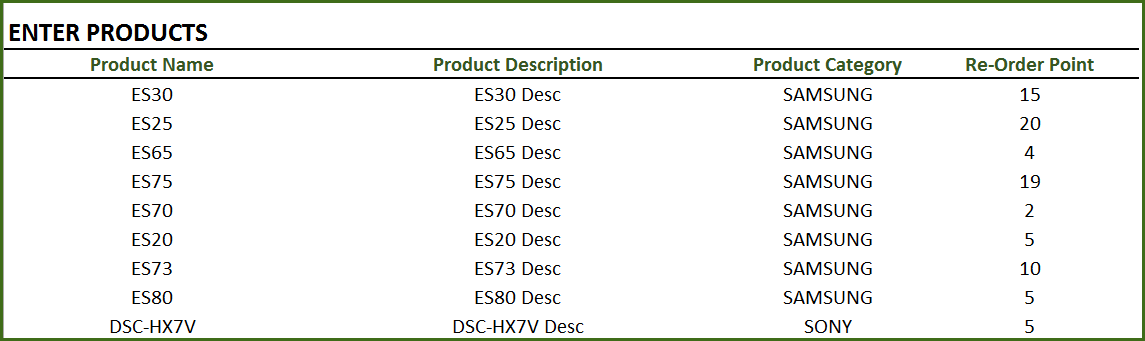
Product Category: This allows you to categorize products. If you have numerous products, categorizing similar products together can help in understanding product performance.
Re-order Point: Amount that you set for each product, where when the current inventory level hits that amount, you will place a new purchase order to replenish inventory. (For more, read Re-Order Point Article in Wikipedia)
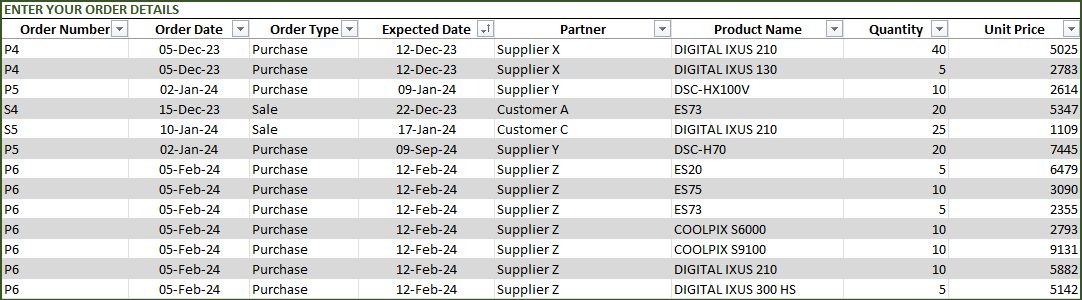
Enter Orders
Enter the line items for all the orders (both purchase and sale) in the Orders_and_Inventory worksheet
If you have any existing inventory when you start using the template, enter them first. You can then continue to enter your new orders (purchase and sales) as they happen. The template will then give you accurate count of your inventory.
- Order Number: This Order number is not used in the template to calculate anything. This has been provided for you to track your orders easily. You can filter the Orders table by choosing specific order number to see all the items in that order. If your systems generate any order numbers, you can enter them here. If you don’t have any such systems, you can create your own. The only recommendation is that you should have a unique order number for each order.
- Order Type: There are two types of Orders: Purchase and Sale. When you place an order to acquire products from suppliers, it is called a Purchase order. When your customer places an order to buy products from you, it is called a Sale.
- Order Date: For Purchase orders, this is the date when the order is placed by you to your supplier. For Sale orders, this is the date when the order is placed by your customer to you.
- Expected Date: For Purchase orders, this is the date when the inventory becomes available for you to sell. For Sale orders, this is the date when the inventory will leave you to the customer.
- Partner: For Purchase orders, your supplier is the Partner. For Sale orders your customer is the Partner.
- Quantity: Number of units of products. The unit can be any numeric value. Even if your unit is not whole numbers, you can still use the Quantity field.
- Unit Price: In Purchase orders, this is the cost of buying one unit of the product. In Sale orders, this is the revenue from selling one unit of the product.
- Amount (Calculated field): (Unit Price X Quantity) = represents the amount of money. In Purchase orders this would be money leaving you and in Sale orders, this would be money that customers pay you.
- Inventory Availability (Calculated field): This is the quantity (number of items) of the product available in inventory as of the Expected Date.
View information about overall inventory availability
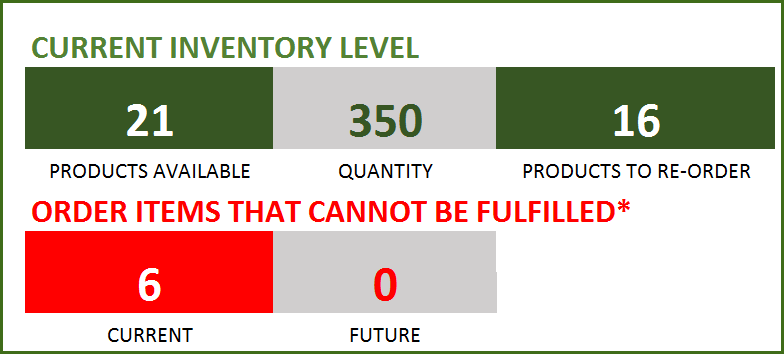
Inventory Spreadsheet Excel Template – Summary Metrics
- Current Inventory of a product = (Total Purchases of Product – Total Sales of Product) as of today
- Products Available: Number of Products where the current inventory level is greater than 0.
- Quantity: Total Number of items of all Products currently available
- Products to Re-order: Number of Products where the current inventory is less than or equal to the re-order point
- Order Items that cannot be fulfilled (Current): Among the orders where the fulfillment date is less than or equal to today, number of line items in orders where the available inventory is less than the Sale quantity
- Order Items that cannot be fulfilled (Future): Among the orders where the fulfillment date is in the future, number of line items in orders where the available inventory is less than the Sale quantity
View details of one specific product
Choose a product from the drop down and see details of that specific product.
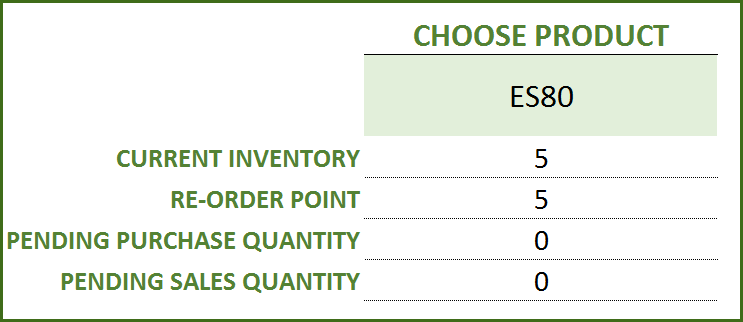
Choose Product to view current inventory
- Pending Purchase Quantity: Quantity in the Purchase Orders that are expected to be available in the future
- Pending Sale Quantity: Quantity in the Sale Orders that are expected to be delivered in the future
View products to re-order
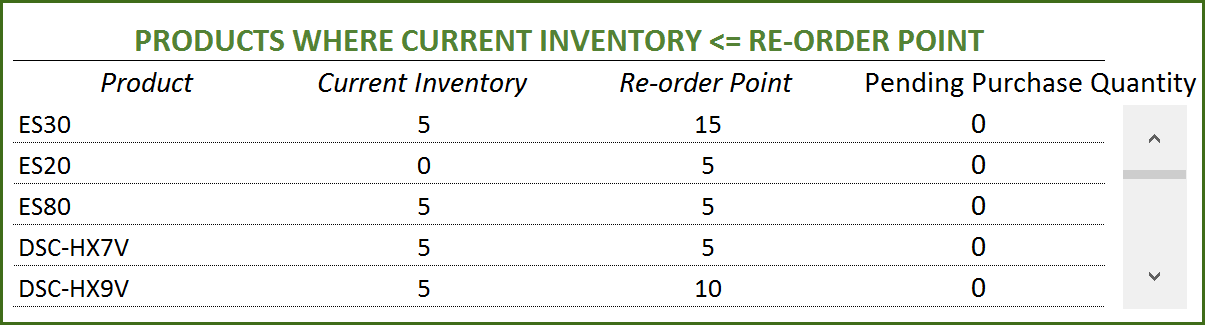
If there are line items that cannot be fulfilled or if there are products to re-order, take actions appropriately
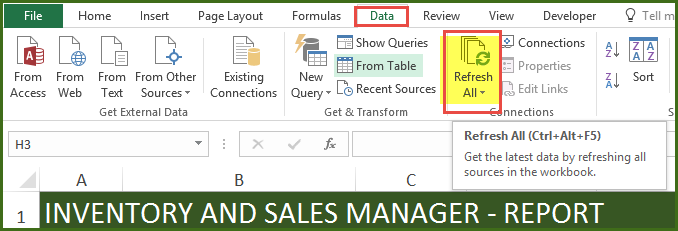
View Report
View the Report worksheet to understand the purchase/sales trends and also to identify the top performing products and most valuable suppliers/customers.
Since there are pivot tables and charts, please refresh the data by pressing Ctrl+Alt+F5 or going to DATA ribbon and selecting Refresh All. This updates the charts with your new transactions.
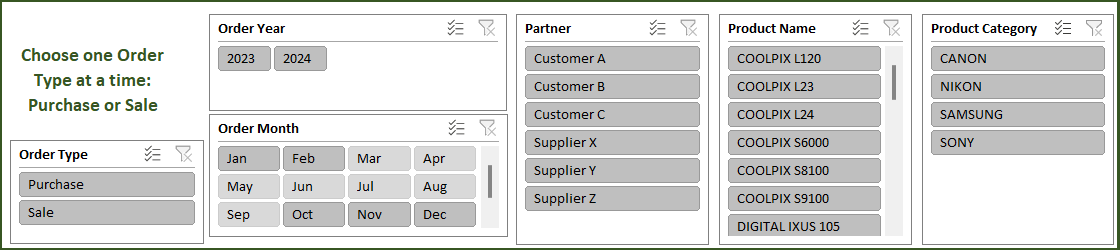
The report sheet has slicers (filters) at the top.
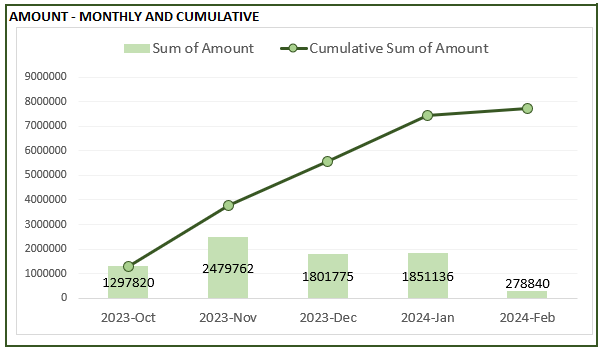
Amount and Cumulative Amount by Month
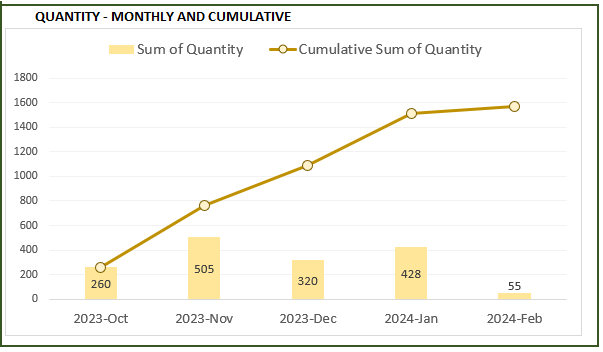
Quantity and Cumulative Quantity by Month
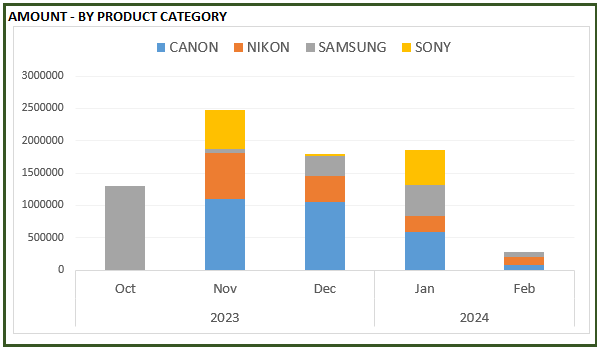
Amount distributed across Product Categories by Month
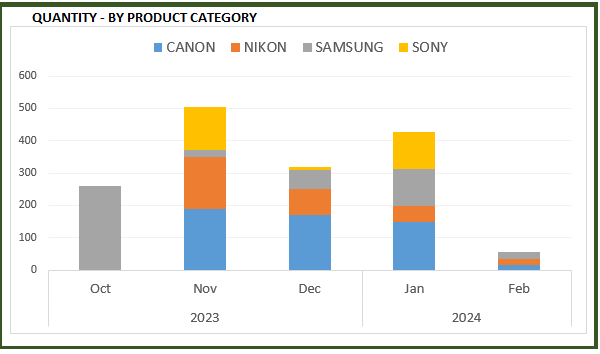
Quantity distributed across Product Categories by Month
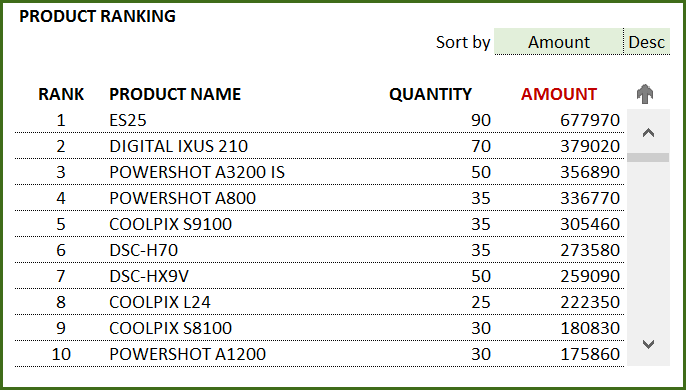
Product Ranking based on Sales Amount or Quantity
If you find the template useful, please share it with others. If you have any feedback, please share it in the comments below.
RELATED FREE TEMPLATES
Manufacturing Inventory Tracker Excel Template (Free)
Rental Inventory Tracker Excel Template (Free)
RECOMMENDED PREMIUM RETAIL INVENTORY TEMPLATES
-
Product on sale
 Retail Business Manager – Excel TemplateOriginal price was: $50.$40Current price is: $40.
 -
 Retail Business Manager (Pro) – Excel Template (Multiple Locations)$50
 -
Product on sale
 Retail Business Manager – Google Sheet TemplateOriginal price was: $50.$40Current price is: $40.
578 Comments
In the premium version, you can choose one or multiple days and the report will provide the summary for the selected days. However, the charts (which is how we can see the trends) are set up only for monthly trends. If you are familiar with the pivot tables, it’s very easy to create daily trends. The data is available in the template in the ‘Analysis_Details’ sheet.
In the free version also, you can edit the pivot tables (in the hidden sheets) to create daily trends easily.
Hope that helps. Please let me know if there are any further questions.
just one more thing, how do I get the template to show me reports on a daily basis and not monthly/cumulated>?
Thank you for this. So easy to use and displays exactly what I want. You have saved me alot of stress, headaches and chocolate!
I am very glad that it is useful. Thanks for taking the time and letting me know.
Hi! Just one question. How did you make a scroll bar on the Orders_and_Inventory worksheet? Please help.
If you don’t see the Developer Ribbon, add from Excel options dialog box.
From Developer ribbon, insert a scroll bar form control.
Right Click on the scroll bar and format – select cell link. In this template, I have linked to cell L5. Then, I use L5 in formulas in column H. By that way, when someone scrolls down in the scroll bar, cell L5 will increase in value and that would mean cell H5 will now change accordingly.
In summary, the scroll bar controls a cell value and once you use that cell value in any formulas anywhere, then they change when scroll bar is used. Hope that helps.
My problem is, how did you input the data on that scrolling list without using the OFFSET function. I tried to analyze your formula, and I just don’t understand it well enough. Please help. 🙁
I will first try to explain in a simplified example.
Let’s say cell L5 is controlled by the scroll bar. So, when you scroll down, value in L5 is incremented by 1. Let’s say in cell H5, we have a formula INDEX($A$1:$A$5, L5). (The actual formula used in the template is more complex than this) Let’s assume cell range $A$1:$A$5 represents a list of product names. So, when L5 is 1, the cell H5 will show the first product. When you scroll down in the scroll bar, L5 becomes 2 and H5 will now show the second product. This is the concept implemented.
Now to the actual formula used. The goal is to find products where the ( Current Inventory – Re-order point) <=0.
INDEX (Product table, Row #). To get the row number, we use the formula
SMALL(IF(INDEX(Tbl_Current_Inventory,,5)<=0,ROW(INDEX(Tbl_Current_Inventory,,5))-ROW(Help!$D$3),””),$L$5-ROW($H$4))
Let’s break this down.
1) use an array formula which will first list all the row numbers of products where ( Current Inventory – Re-order point) <=0. if that is not true, instead of returning the row number, it will return blank.
IF(INDEX(Tbl_Current_Inventory,,5)<=0,ROW(INDEX(Tbl_Current_Inventory,,5))-ROW(Help!$D$3),””)
2)Then, order them using the SMALL function.
3) Since we want the first product in H5 and the second product in H6, we use $L$5-ROW($H$4) in H5. When you drag this formula down to H6, it will update accordingly.
This is an array formula and so after you type the formula instead of pressing Enter key, you have to press Ctrl+Shift+Enter. That creates the array formula.
Hope this helps. If this is not clear, I can do a video when I am able to.
Thanks,
am asking all this because i want to be able to create a daily or monthy profit/loss income data,. please if there is a way you can help i will highly appreciate. i will pay for your trouble if i have to, but i think what you offer is the simplest yet very accourate accounting program
Thanks again for the compliments.
The premium version calculates monthly profit/loss. Please try and if the template does not meet your business needs, please e-mail me and we will issue a full refund.
am trying to convice my employers about your premium product using your free product,. after I buy the premium product will I be able to use it or rather put it on multiple computers>? if its limited, then whats its maximum capacity? With this current template, I have a problem, how will I be able to get the total purchasing cost of the available inventory? or the total purchasing cost of the goods sold? so that i may be able to see the monthly or daily profit?
I have to point out that your template has changed my view on inventory management., thank you very much,
Thank you for the kind words. I am glad it’s useful.
You can place the file on a shared drive and have multiple people have access to it. Or you can make copies and use it in three separate computers at a time.
The premium version calculates monthly profit/loss. It does not calculate the purchasing cost of the currently available inventory. It lists each product’s current inventory in a table. You can use that and calculate the cost of the current inventory easily.
Hope that helps.
does it keep record of the purchasing price of an item?
If you
buy 5 units of Product A for $500 total ($100 for each unit) in May 2014,
sold 3 of those units for $600 ($200 each) in May 2014.
buy 10 units of Product A for $800 total ($80 for each unit) in June 2014,
sold 2 units for $500 ($250 each) in June 2014.
It will show up as
Purchase amount of $500 in may 2014
Sales amount of $600 in May 2014
Profit of $100 in May 2014
Purchase amount of $800 in June 2014
Sales amount of $500 in June 2014
Profit of -$300 in June 2014
Hope that helps. Profit/Loss is not calculated in this template for each specific unit. It is calculated on the Product level and the date level (Date/Month).
Also, you will be entering each line in your order. This means that you can always refer back to historical orders to see exactly how much was paid for a product over time.
HI,
THANKS FOR SHARING THIS TEMPLATE
YOU DIDNT MENTION WHERE TO ENTER EXISTING INVENTORY ITEMS
THANK YOU
You are welcome.
In the Orders and Inventory sheet, you enter your existing inventory items (one row for each unique product) with Expected Date of Jan 1st, 2014. Then, you can continue entering your new orders in the same sheet. Hope that helps.
Thanks for your reply.
this is the best template i have seen till now, easy to understand
One more doubt
our business runs on credit basis.
i need at least 20 days to pay my suppliers..
My customer will pay me 2-4 installments.
How can i enter multiple payments or receivables in your excel template?
I’m new to this excel or accountings,
If possible you can reply me on rajeev@neoglobalindustires.com
I need a custom template for all our businesses (we get raw materials from suppliers then to our production unit then to distributors ) and we also want to introduce barcode system to gather data. if you need more details i can provide you
How the payments happen do not impact the inventory calculations in the template. Expected Date is the date when the product leaves your warehouse (for sale orders) or reaches your inventory (for purchase orders).
Order Date is used only for analysis on sales/purchases in the Report sheet. In your scenarios, for one order which has one order date, you may receive the payments in 4 installments across multiple months, You would not enter them separately. The Report sheet will only reflect the sale amount in the month of the Order Date. This means that the Report sheet doesn’t truly reflect when you received payments.
In summary, for your scenario, inventory levels shown in the template will work fine. The Report sheet will not reflect the true cash flow.
Hope that helps.
is there any way that we can add the installments payments to the file , that would be amazing because it will reflect the cashflow statement ?
Hello
This template is designed for inventory tracking and would not be able to deal with cash.
Best wishes
I am not familiar with collecting information from bar code scanners. Sorry.
Many Thanks.Good Work.Appreciated
Greg
You are welcome. Thanks for your feedback.
interesting template..thanks for sharing free
Thank you.
You are absoulutely THE BEST!!! Thank you for sharing your knowledge. This will definitely come handy for my small store inventory management. I was clueless on how to get started until I found you. Im loading my spreadsheet and will let you know how it goes. Just like some have already asked (how to know the daily sales for a store) I will be curious to find out.
Bravo Ins Zara, Bravo!!!!
Thank you very much. I am glad it’s helpful.