Recruitment Tracker 2025 – Free Recruitment Template in Power BI
Recruitment Tracking – Simplified!
This template is designed for Microsoft Power BI, but if you are looking for a Excel template, please visit Recruitment Tracker in Excel or, we have a Google Sheet version of this template here Recruitment Tracker in Google Sheets.
With simple data inputs, get an amazing dashboard with metrics and reports to aid you in analyzing the recruitment process and take key decisions.
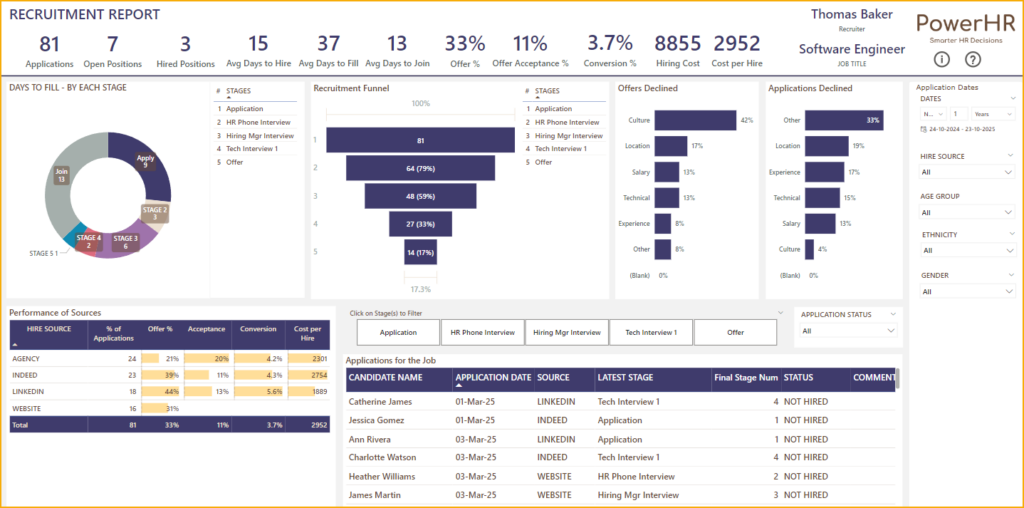
Key Features of the Recruitment Tracker Power BI Template
The following are the highlights of the template.
- Simple data entry process
- Single excel file for all employee data entries
- One time connection with Power BI file
- Customize settings to meet your business needs
- Customize the Applicant and Recruitment attributes to suit your recruitment process.
- Practical Features
- Simple Dashboard with crucial metrics and reports.
- Can handle multiple stages of recruitment (max. up to 5)
- Track performance of various sources of hiring.
- Identify recruitment bottle necks using the recruitment funnel chart.
- Optimize the recruitment process by identifying major causes for application and offer declines.
- Ease of Use
- Easy to enter data in excel file.
- Need one time connection with Power BI to instantly get the dashboard populated.
- Automated Calculations
- Fully Automated Dashboard and straight-forward data entry set-up in excel.
Key Features of the Recruitment Tracker Power BI Template
Downloads
To manage multiple jobs with more features, please see the new Recruitment Manager Power BI Template.
How to use the Recruitment Tracker Power BI Template
Once you download the template, you’ll receive a Power BI file (.pbix), two excel files (template and a sample file)
Here is the overview of steps to use the template.
- Enter all the application data along with application settings details in the Excel template (empty template file, you can use the sample data file as reference)
- Save the file, copy the path and close it.
- Establish a connection with the Power BI file using the steps mentioned here.
- Once a successful connection is established, view the fully automated dashboards in the Power BI report, instantly.
- For any changes made in the excel, please close the excel file after the changes and refresh the Power BI file to get the updated dashboard.
Data Input
Step 1: Enter Settings
Enter the applicant attributes, recruitment attributes as shown below in the excel template file.

Step 2: Enter Applications
In the “APPLICATIONS” sheet, enter the Job title, the recruiter, Job posted date and the total number of open positions for this particular job role.

Also, enter all application information like Candidate name, application source, and other details as required.

- Enter Candidate (Applicant) name and Application Source.
- Enter dates when the applicant reached each of the stages. If the applicant does not reach a stage, leave it blank.
- When a decision is made to not proceed with an applicant, enter NOT HIRED in the STATUS column or if the position is fille, enter HIRED.
- Enter ‘decline reason’ for candidates who were “not hired”.
- Cost is the cost incurred against the particular recruitment process.
- Hire Date is the date when the hiring decision was made.
- Join date is the date the candidate joins or starts working for the organization.
Once the data entry are made, copy the excel path and save and close the file.
Step 3: View Recruitment Tracker Power BI Template
Once the data entry in excel is complete, save the file and copy the link.
Establish a connection with the Power BI file by following these steps. Once a successful connection is established, you can view the fully automated dashboard.
View the key metrics in Recruitment tracking, instantly for the Job opening posted.

The metrics are:
- Applications : The number of applications received for given date range
- Open Positions: Currently open positions for the job posting.
- Hired Positions: Number of applications that are hired.
- Avg. Days to Hire: Average number of days between application received date and candidate hire date +1.
- Avg Days to Fill: Average number of days between job posted date and candidate join date +1
- Avg Days to Join: Avg days taken from Hire Date to Join Date
- Offer% : % of applications reaching the Offer stage of all the applications received.
- Offer Acceptance%: Percentage of applications hired of all applications that reach offer stage.
- Conversion% : Percent of application received that got hired.
- Hiring Cost: Sum of the costs incurred
- Cost per Hiring: Average cost of hiring a candidate (applicant) for the job.
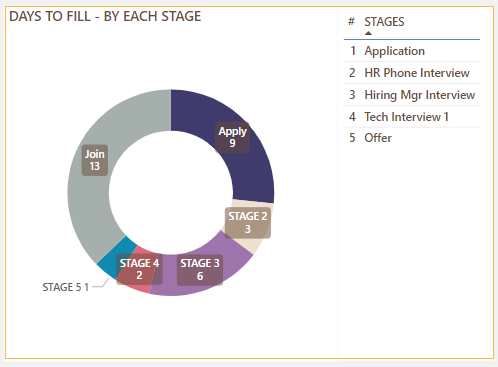
Days to Fill
You can see the days taken to fill for each of these stages.
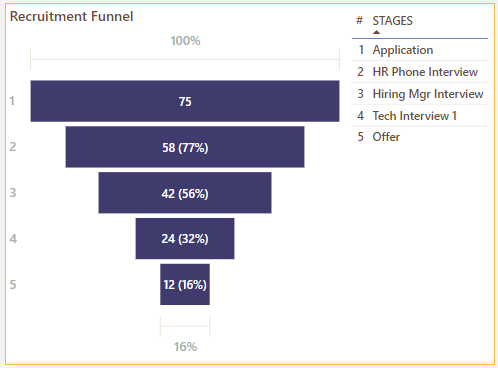
Recruitment Funnel
As you are hiring, the funnel will represent the efficiency of the hiring process. As each stage you can view the number (and %) of applicants flowing into the subsequent stages.
Offers declined and applications declined charts shows the reasons due which the application hasn’t moved to a hired position. The factors shown can be used to further analyze on how to improve job descriptions and/or interview processes.

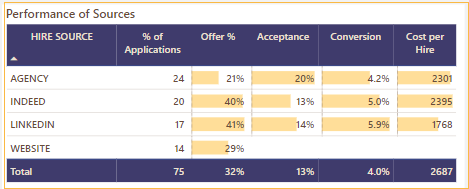
Performance of Sources
Identify how each of your recruitment sources are contributing to the recruitment process by the given table.
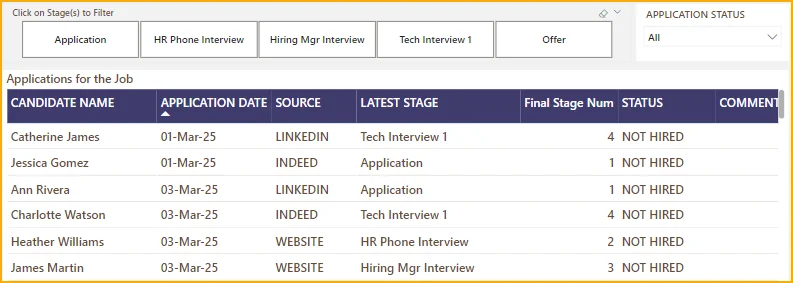
For the job posted, see all the key information such as application date, source, the latest stage in the report table. This can be filtered based on Stage and/or the Hired status.
Do you find this recruitment report template in Power BI useful? Are there any additional scenarios that would be good to incorporate? Is there anything obvious I have missed? Please share your thoughts in the comments below.
If you like this recruitment tracking template, please share with your friends.
Recommended Template
If you are looking to manage multiple jobs and get advanced reporting, please try Recruitment Manager Power BI Template


2 Comments
Hello. I’m interested in the Recruitment Manager Power BI Template, but wanted to try your free trial version to ensure I could connect my data properly. I’m almost there, but continue to get an error in cell B1 (=SUM(T_APPLICATIONS[ERROR IND]) &” Error records”) of file Recruitment_Tracker_Sample_v1_1. All rows show as errored even though they have the Required Date (Application Date) completed.
Any help would be appreciated.
Thank you for showing interest in our template. We regret the inconvenience caused.
The cell B1 in application sheet will show the number of error records present in the application table. If it shows more than 0, please check the column AB to identify the error. If you are still facing issue, please share your copy of the template with sample data having the highlighted issue to assist further:
https://support.indzara.com/support/tickets/new
Best wishes.