You can use this template to build your own watch list of stocks.
In this article, I will go over the free Stocks Watch list template and its features.
Video Demo
Download
Template features

This template can be used to create your own list of stocks that you want to track performance.
- Add a stock ticker symbol to the table and instantly see performance data
- Customizable columns to display data of your choice
- 21 day price history data trends shown
- Indicator to highlight if a stock price exceeds previous 21 days’ high
- Indicator to highlight if a stock price is lower than previous 21 days’ low
To add a new stock to your watchlist, just type a stock symbol in the cell just below the existing symbols – as shown below.
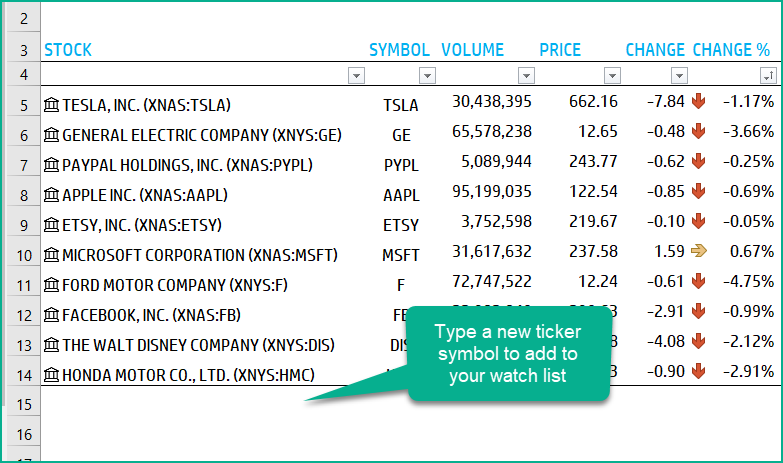
You can see the trading volume, current price, change and change %.
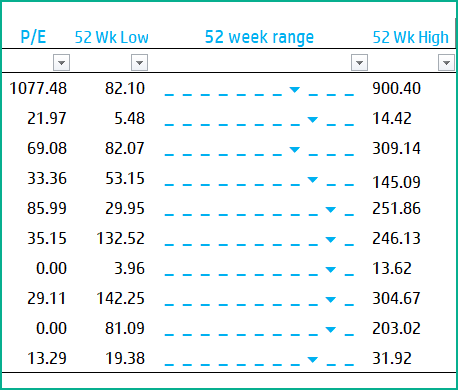
You can also see the 52 week price range of each of the stocks.
Customizable Columns
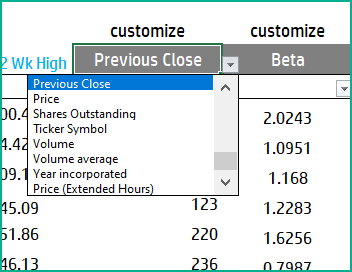
There are two customizable columns as well.

You can change what is displayed in these two columns easily.
columns
The drop down list shows all the available fields that you can choose from.
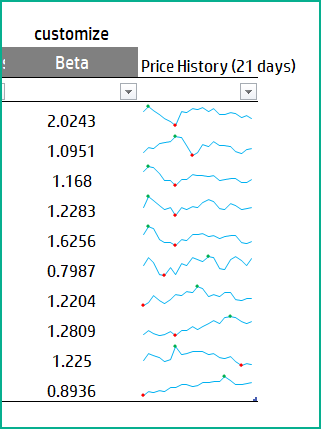
21 day history
We also have the price history for the previous 21 days.
Changing the rules for colors
To change the colors of the arrows, you can change the conditional formatting rules.
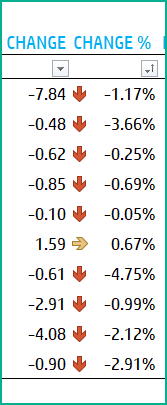
You can change the conditions easily by typing in a different value for the Green and Yellow colors.

Recent performance Indicator
We also have a column to indicate recent performance.
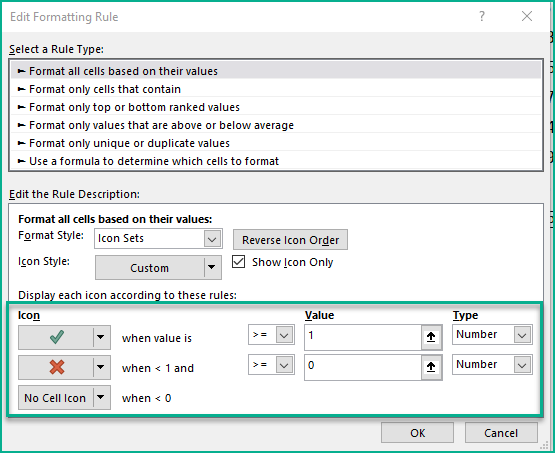
If the price > max (21 days history of closing prices) then we will see a check mark.
If the price < min (21 days history of closing prices) then we will see a cross mark.
The foundation of this template is the Stocks Data type and StockHistory function.
Please read more on Stocks Data Type.
Please read more on StockHistory function and how we use to extract the price history of a stock or currency.
Here is the link to the article from Microsoft which shows which exchanges are available and the delay in data refresh for each.
How to refresh?
To refresh the price and other information, just use the regular Excel refresh in the Data ribbon.

Requirements
Microsoft has introduced a new feature in Excel called Data types. One of the data types is ‘Stocks’. That’s what we will be using for these templates. This feature is available in Microsoft 365 Subscription Plans for PC and Web
For all the templates in this ‘Excel for Stock Market’ series, please visit indzara.com/stock-market-templates
-
SMA Strategy Backtester Google Sheets Template$25
-
SMA Strategy Backtester Excel Template$25Rated 5.00 out of 5 based on 1 customer rating
-
RSI Strategy Backtester Google Sheets Template$25
-
RSI Strategy Backtester Excel Template$25
-
MACD Strategy Backtester Google Sheets Template$25
-
MACD Strategy Backtester Excel Template$25
-
Simple Moving Average Stock Screener Google Sheet Template$25
-
Stock Screener Excel Template$97Rated 4.75 out of 5 based on 4 customer ratings
-
Simple Moving Average Stock Screener Excel Template$25Rated 5.00 out of 5 based on 1 customer rating
Feedback
Please share your experience. I expect this to be different with different exchanges and countries. Is it working for you? Is it working differently? I would love to hear from you.
Related Templates
- Stock Price Chart Excel Template
- India Stock Market Tracker in Excel – LIVE Updates
- London Stock Exchange Tracker in Excel – Stock Market
- Two Stocks Comparison Excel Template – Live Data
- US Stock Market Tracker in Excel – LIVE Updates
Get your copy of 30 free templates now!
Get 30 Free Stock Market Templates!
Thank You !!
Please check your email for the link to 30 templates

