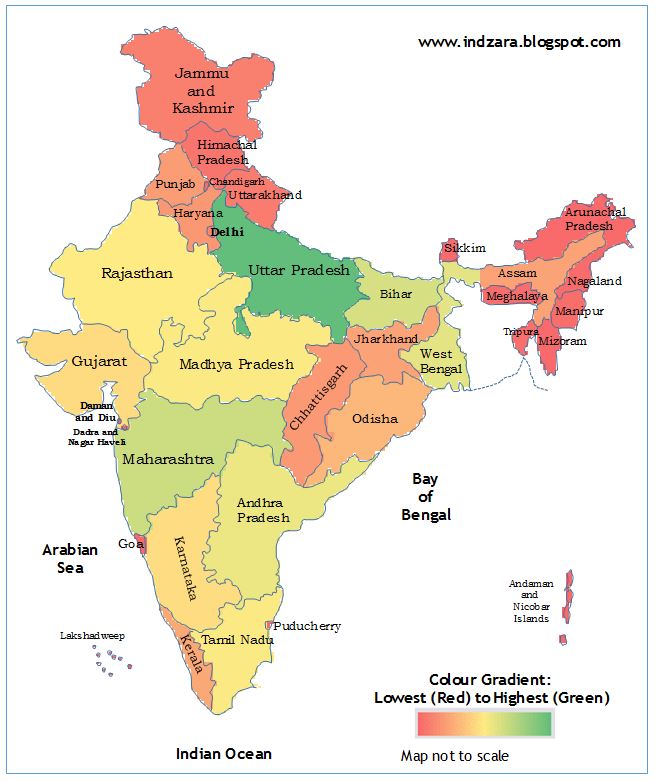
Geographic heat map – India (Excel template)
I was looking for a way to present/visualize state level data on an Indian map. I was not able to get that from the Bing maps application for Excel.
I am sure there are paid applications that might provide this functionality. I think this is a very basic need and I decided to prepare a simple template that can help create geographic heat maps for India.
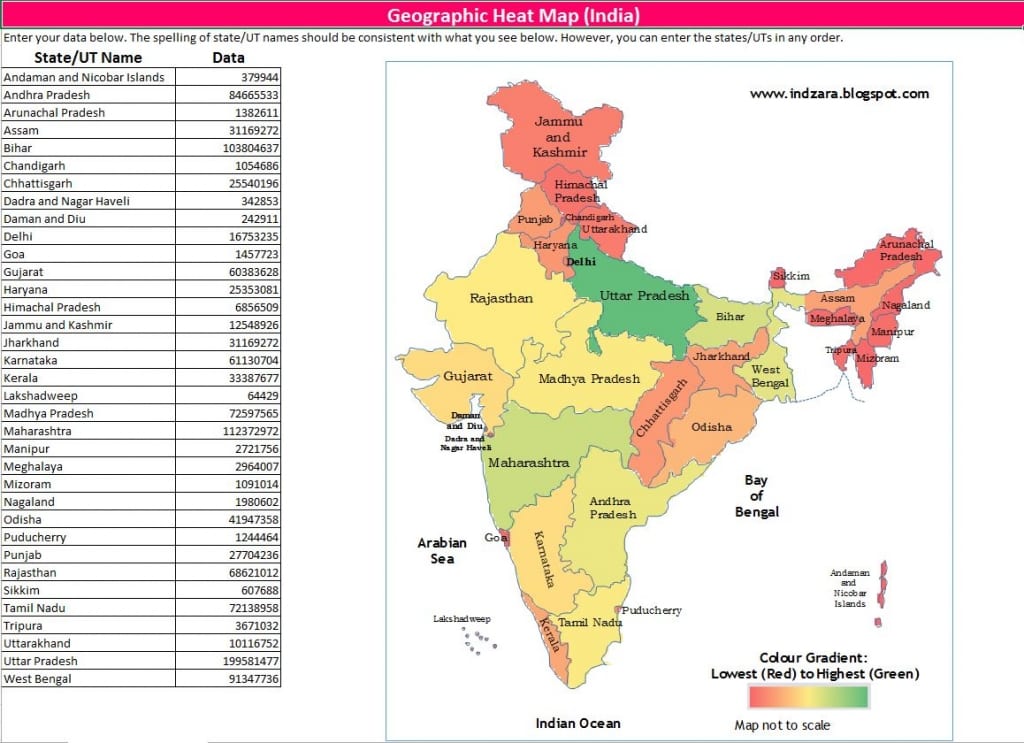
India Heat Map Excel Template

Download
If you would like to create editable map of India in excel free download the India Heat Map Excel Template (Telangana added in June 2014)
Please see below, a quick 5 minute demo of this template.
How to use this India Heat Map Excel Template?
- Enter your (numeric) data in the data column and the map image on the right gets updated.
- Please make sure that the state (or union territory) names you enter in column A are spelled the same way as they are
- They are currently ordered alphabetically. However, you may choose to enter them in any order.
- You can print the sheet if needed
- You can copy the image and paste it in other applications such as Microsoft Word or PowerPoint

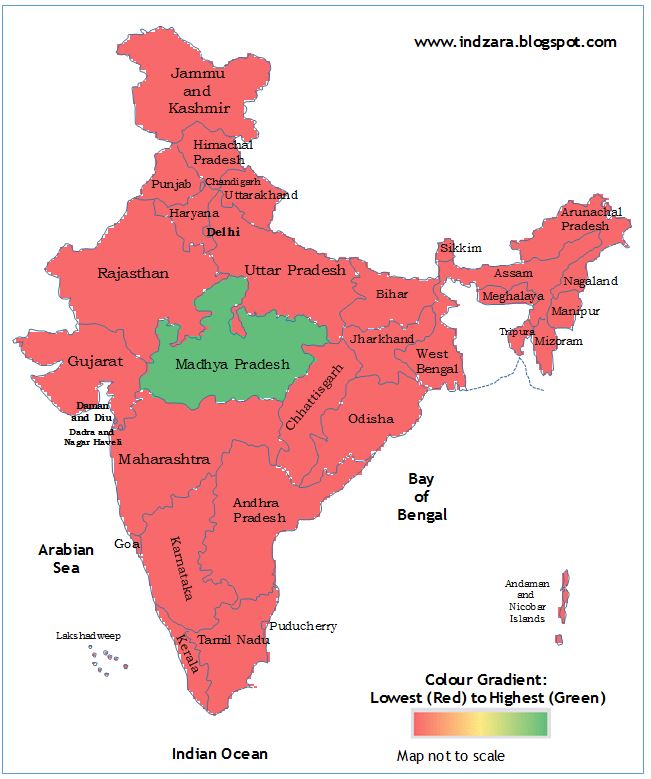
You can also use this template to showcase the position of one specific state.

For the illustration above, I entered a positive number (1) for Madhya Pradesh and deleted the data for all other States/UTs.
How is the heat map generated?
The India Heat Map Excel Template has a hidden worksheet where the outline of India and States/Union territories were drawn with the cells pointing to corresponding data. Conditional formatting has been used to create the heat map.
If you would like to change the color gradient, read this article.
If you know of better ways to do this or if you use any application to create such an excel map chart India heat maps, please share your thoughts.


181 Comments
I woulk to be a friendship this website, i don’t see the sign up
Thank you very much for your interest. You can subscribe to the blog using your e-mail address. Please see the side bar on the right. You can also subscribe to the YouTube channel. https://www.youtube.com/user/theindzara
Interesting…this heat map issue … Looks like the predictions in the 1981 book by Joel Garreau “Nine Nations of North America” came true. You should read it (If you haven’t) it’s a great book.
thanks for your reply will wait for district level maps,but surely it will help lot of people.
Already we are using your state level heat maps
I wanted to thank you for your effort Thanks 🙂 🙂
Hello Sri,
Thanks. I am glad that the map is useful. Please e-mail me at indzara at gmail, if you don’t mind, and let me know how the map is being used. It will be good to know.
Hi
your template helped me lot.How to add districts with in State.
can u guide me plz
Thanks and regards
Hello bhai,
Thanks. I have not created the district level maps yet. I plan to create them in the future. I will post them. Please subscribe to my blog to be notified.
Hello ind zara,
I need it for Mumbai Region, Pincode wise.
Will be greatly helpful
Regards,
Anand Saboo
I am very sorry. I don’t have map for any cities.
Best wishes.
Congratulations. It’s pretty good. How does this the hidden ‘Data’ sheet? It is macro? Never seen anyone do that. The net has.
Thanks. 🙂
You can unhide the ‘Data’ sheet and see how I built it. It has a lot of cells with simple formulas. There is no macro.
It’s not difficult, but it takes a lot of patience and time. When I find a better method, I will post a video on it.
Parabéns, Indzara. Seu mapa tá show. Como faço para criar meu próprio mapa aqui no Brasil?
According to Google translate, you are saying
“Congratulations Indzara. Your map okay show. How do I create my own map here in Brazil?”
Thank you. It was a manual effort for me to draw the outline of the country map and then have Excel cells with formula that points to the numbers in the data. I applied conditional formatting after that. I need to find a better method to create the map so that I can create for other countries too.
Indzara your map is excellent
Thank you very much. I am glad it was helpful.
Indzara your map is excellent
Dear Indzara,
Greetings, Your map is excellent, how can we change colours as green lowest and Red highest.
Please help.
Thanks
Kamalesh
I have written a new article about that. Please visit
https://indzara.blogspot.com/2013/08/changing-colour-gradient-in-heat-map.html
I hope it helps.
how can we change colours as green lowest and Red highest?
Hello Nisha Sachan,
It’s done using conditional formatting on the hidden ‘Data’ sheet. If you are familiar with Excel, you can unhide the ‘Data’ sheet and change conditional formatting. If you are not familiar with condistional formatting, I can either change the colours (Green lowest and Red highest)and e-mail a new template to you. Or I can provide instructions/video to explain how to change colours. Please let me know what you prefer.
Thanks for using the template. I hope it’s useful.
Thanks for the revert was able to reverse the gradient,can we be able to mention numbers as well on the states along with the colors.
Yes, we can insert text box (or Shape) for each state in the hidden ‘Data’ sheet and in the formula bar point to the corresponding cells (numbers) in the Geographic_Heat_Map sheet. These text boxes with numbers will automatically appear on the map in the Geographic_Heat_Map sheet. If you would like a copy of the template with the numbers, please e-mail at indzara at gmail.
Hi Indzara
can you share the templete with the heat map showing numbers along with the state name.
I have emailed the file to you. It is for the older map where Andhra Pradesh was unified as one state. Thanks. Best wishes.
Ind Zara Just Now I have seen you map. It was excellent. I also wanted to generate districts map to prepare a report card for advocacy of Government of India. I want to fill the colours as per our WBTi scoring. Can I generate colour map for districts also as per my colour requirement?
Sorry, I don’t have district level map.
Best wishes