Geographic heat map – India (Excel template)
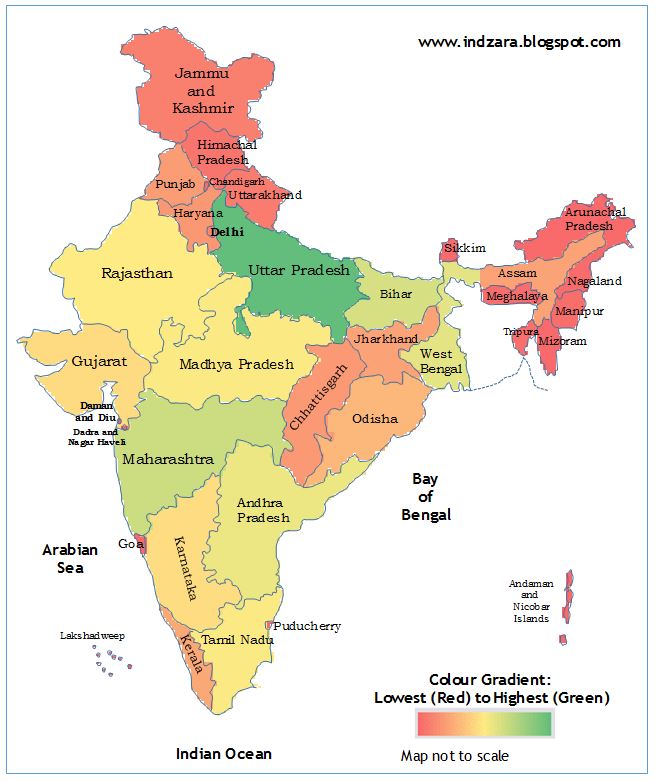
I was looking for a way to present/visualize state level data on an Indian map. I was not able to get that from the Bing maps application for Excel.
I am sure there are paid applications that might provide this functionality. I think this is a very basic need and I decided to prepare a simple template that can help create geographic heat maps for India.
India Heat Map Excel Template
Download
If you would like to create editable map of India in excel free download the India Heat Map Excel Template (Telangana added in June 2014)
Please see below, a quick 5 minute demo of this template.
How to use this India Heat Map Excel Template?
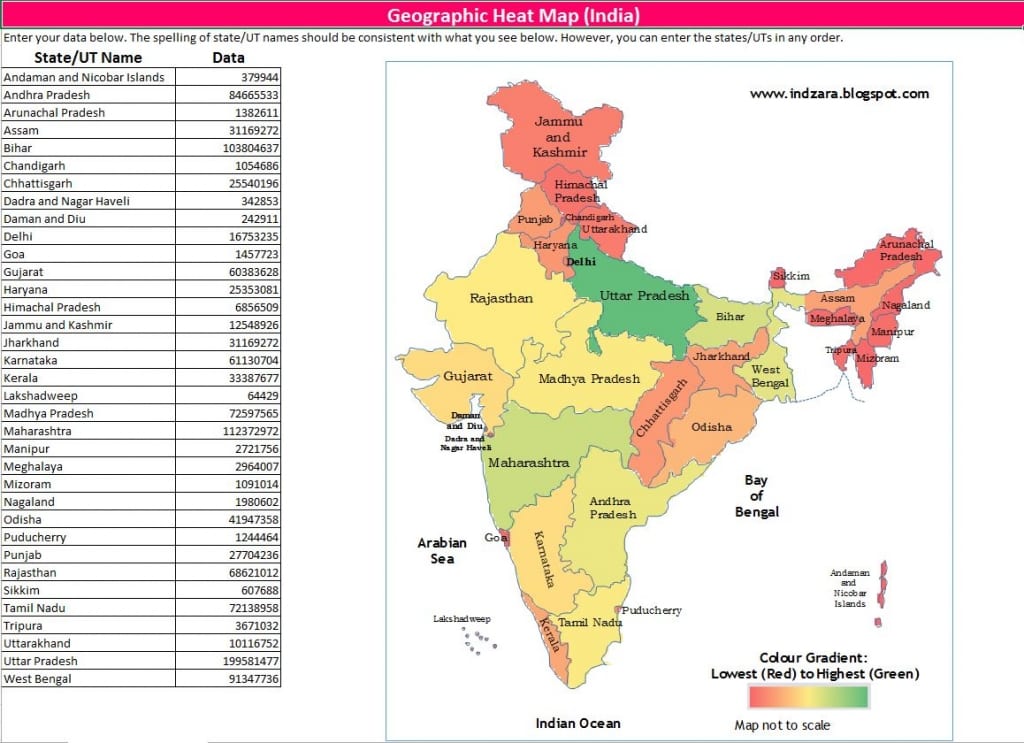
- Enter your (numeric) data in the data column and the map image on the right gets updated.
- Please make sure that the state (or union territory) names you enter in column A are spelled the same way as they are
- They are currently ordered alphabetically. However, you may choose to enter them in any order.
- You can print the sheet if needed
- You can copy the image and paste it in other applications such as Microsoft Word or PowerPoint
You can also use this template to showcase the position of one specific state.
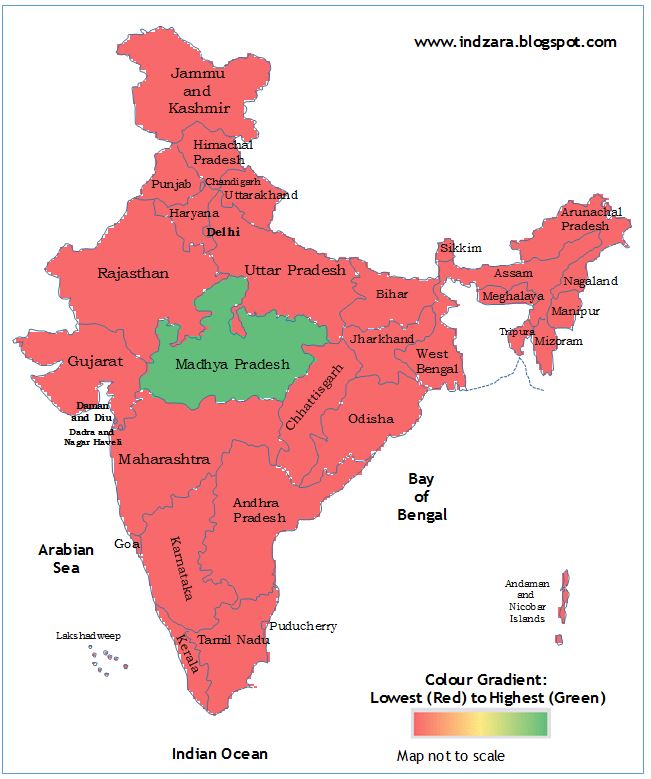
For the illustration above, I entered a positive number (1) for Madhya Pradesh and deleted the data for all other States/UTs.
How is the heat map generated?
The India Heat Map Excel Template has a hidden worksheet where the outline of India and States/Union territories were drawn with the cells pointing to corresponding data. Conditional formatting has been used to create the heat map.
If you would like to change the color gradient, read this article.
If you know of better ways to do this or if you use any application to create such an excel map chart India heat maps, please share your thoughts.


183 Comments
Thank for your revert.
I want to generate a district level map for India, can it be done through Indzara tools? If this cannot be done through Indzara, kindly guide me with a proper source (in case available). Thanks
Thanks for your interest. I don’t have the district level maps. Unfortunately, I don’t know of any other source for it as well. Best wishes.
Hi,
I downloaded your latest template. However, the picture quality is not as depicted in this post. Also, the legend of the color gradient is also not appearing. Please let me know how can I correct this.
Thanks
Thanks for your comment. The picture quality should be the same. The file posted was updated in June of 2014 (while the post was originally made in April 2013) when the new state of Telangana was added. At that time, I removed the color gradient legend image and just had the text indicating the gradient. This is because if you change the color by using the conditional formatting gradient rules(explained https://indzara.com/2013/08/changing-the-colour-gradient-in-the-heat-map/) , then you need to update that gradient legend image too which becomes more work.
If you need the legend image, you can take a screenshot of the gradient scale from Excel’s conditional formatting menu and paste. If you need any further assistance, please email me at indzara at gmail. Thanks.
Thank you so much for your work here. The latest download file does not show the map heat legend – the colour gradient key is missing. Thanks Kev. London
You are welcome.
I had removed the heat gradient legend. If the user changes the color gradient by following the method explained in https://indzara.com/2013/08/changing-the-colour-gradient-in-the-heat-map/ , then the default gradient legend is not applicable. I don’t know of a way to dynamically update that. So, I removed it from the default template.
You can definitely take a screen capture of gradient and paste the image on the map. Please let me know if there is any help needed. Thanks & Best wishes.
Hello and good job, How did you bring that image from the data sheet to be shown with the Geographic heat map sheet?
Did manage to create unified Andhra on the map. One just had to delete aline. Thanks again.
I am glad that it worked for you. After you remove the line, please make sure that the values entered for Telangana and Andhra are the same. Best wishes.
It its not too much of a trouble will it be possible to share the older map with shows Unified Andhra. No I don’t have anything against Telangana and its bifurcation, its just that I am using a older dataset from the first decade of this century. I tried changing the borders but my online drawing skills are atrocious .
This map is extremely useful. And thank you so much for allowing users to edit stuff on the map. Cheers to Indzara and its commitment to keep knowledge open access.
You are welcome. Thanks for the feedback on the Excel Template.
Is there any way we can get the districts heat map in India or postal code maps of the Indian cities?
I am sorry I don’t have districts level or postal code level maps. Best wishes.
how to use this map image in other excel files and link it with different data. pls guide me.
I am not sure I understand what your specific scenario is. The image of the map can be copied (just select the image and copy in Excel) and pasted in any Office application (PowerPoint, Excel, Word). It will just be an image.
If you want to use different data to create a new map, you can enter that data (overwrite) in this sheet and the map image will be updated with your data. Hope this helps. If this doesn’t answer your question, please explain your specific scenario. Thanks.