You can use this template to build your own Moving Average Crossover technical indicator for any stock.

In this article, we will be covering the Exponential Moving Average Crossover template and its Features
Technical Indicators
Technical Analysis is the study of market action, primarily through the use of charts, for the purpose of forecasting future price trends. ‘Market action’ includes the three principal sources of information available to the technician – Price, Volume and open Interest.
Technical Analysis of the Financial Markets – John J. Murphy
Technical indicators are calculations that are performed on the history of the stock, primarily the price and trading volume of the stock, in order to determine when to buy or sell.
There is a lot of technical indicators, commonly used by traders. There is also no limit to what calculation you use to identify trading signals – when to buy, when to sell, when not to buy or sell.
We will see how we can use Excel to calculate some of the most used technical indicators.
Video Demo
What is Moving Average Crossover indicator?
This template builds on the previous Exponential Moving Average (EMA) template. In that template, we built one EMA line. The Crossover method uses multiple EMA lines and allows creating trading strategy based on whether and how one EMA line crosses over another EMA line.
Typically, the EMAs would be of different lengths. In a triple crossover strategy, there would be a Fast EMA (short length), Medium EMA (medium Length)and Slow EMA (Long length).
Let’s review what Exponential Moving Average is.
Exponential Moving Averages
Moving Average is one of the most used technical indicators.
Exponential Moving Average is a type of moving average. It is designed to address a couple of the criticisms of the other Moving Averages.
- Simple Moving Average it gives equal importance (or weight) to all the data points considered in calculating the average.
- Weighted Moving Average completely ignores the history beyond the length of the weighted moving average. For example, a 50 period weighted moving average only considers the price of the 50 periods and completely ignores the history beyond the 50 periods.
This is where the Exponential Moving Average (EMA) comes in.
Let’s take a simple example where we have closing price of a stock for each trading day.

To calculate the EMA of 12 periods, for March 26th,
- We calculate the Multiplier first.
- Multiplier = Smoothing / (1+ Length)
- Most used Smoothing is 2
- For a 12 period EMA, this multiplier is 0.154 (rounded)
- EMA = (Today’s Value * Multiplier) + Yesterday’s EMA * (1-Multiplier)
- You can see that today’s value is given 15.4% weight but yesterday’s EMA is given 84.6% (100-15.4%) weight
- Yesterday’s EMA will depend on the day before yesterday’s EMA. This keeps going on. This is how the entire price history is considered when we arrive at today’s EMA. Thus this addresses the downside of the Weighted Moving Average.
- In the example, ($232.34 * 0.154) + $234.98 (1-0.154) = $232.98
This is how we calculate the 12 period EMA.
A couple of parameters in this calculation are
1) Length of the moving average – how many periods to use for calculating average. In the example above, we used 5.
Common moving average lengths are 10, 20, 50, 100 and 200.
If the length is greater, the smoothing effect is greater and the indicator is less impacted by sudden price fluctuations.
2) Source – what value are we averaging. In the example we used the closing price of the stock.
Though Closing price is the most used for calculating simple moving average, you can also use High, Low, Open, and Volume as well.
Signals
Commonly used trading signals using the Moving Average Crossover method is listed below.
How to use a 4-9-18 day moving average system
The shorter the moving average, the closer it follows the price trend. It stands to reason that the shortest of the 3 averages – 4 day – will follow the trend most closely, followed by 9 day and then the 18 day. In an uptrend, the proper alignment would be for the 4 day average to be above the 9 day which is above 18 day average.
In a downtrend, 4 day would be the lowest, followed by 9 day and then the 18 day average.
A buying alert takes place in a downtrend when the 4 day crosses above both 9 and the 18 day averages. A confirmed buy signal occurs when the 9 day then crosses over the 18.
When the uptrend reverses to the downside, first thing that should take place is that the shortest average – 4 day – dips below the 9 day and the 18 day. This is only a selling alert. If the longer average – 9 day – drops below the 18 day, a confirmed sell short signal is given.
Technical Analysis of the Financial Markets – John J. Murphy
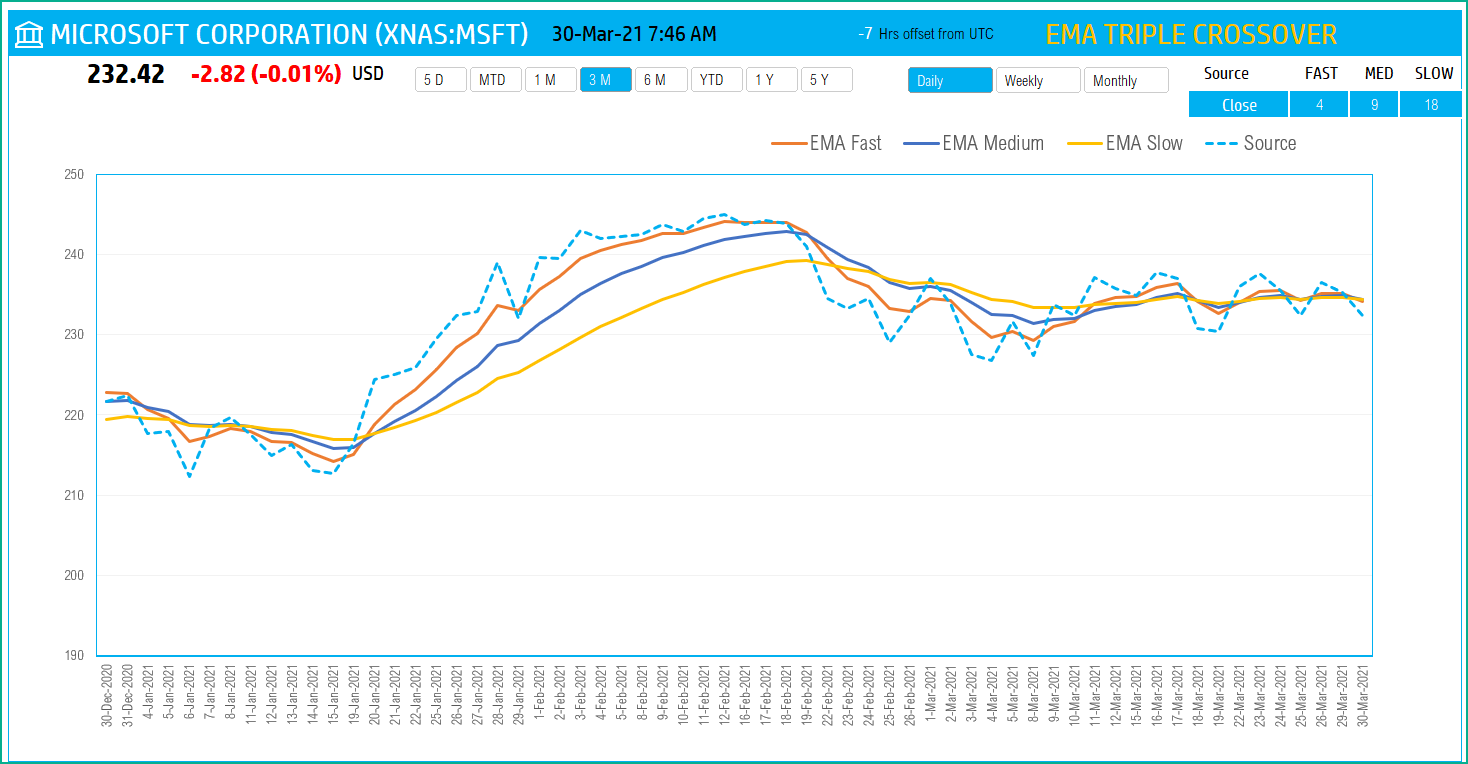
Exponential Moving Average Crossover Template
The template will help you create 3 Exponential Moving Average lines.
Download
How to create Moving Average Crossover in Excel?
Type in a stock sticker symbol. If Excel does not recognize your stock symbol, it will pop up this data selector box.
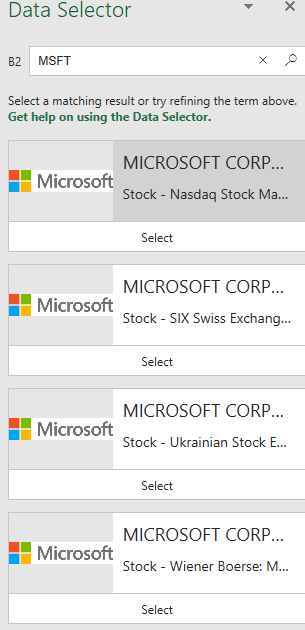
You can select the stock you are interested in.
Period
The template can pull up to 5 years of price history by default. You can choose how much history to display on the chart easily using the slicer buttons.

The options are 5 Days, Month Till Date, 1 Month, 3 Months, 6 Months, Year Till Date, 1 Year, 5 Years.
Interval
The template allows price history at 3 different intervals.

Daily/Weekly/Monthly are the options.
Moving Average Crossover Inputs – Length and Source
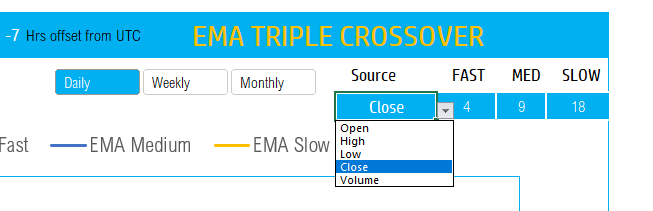
Source: Choose from the drop down list of the 5 options for source values.
Lengths: You can type in a length in periods. For example, in the above screenshot, we have entered 4 for Fast EMA, 9 for Medium EMA and 18 for Slow EMA.
The chart will update automatically based on all the above inputs.
Timezone
On the top right you can see the maximum of the last trade time of these currencies.
The default time that Microsoft provides is UTC. The offset is set to -7 hrs, to convert to pacific time zone.
You can modify this if you need the time in a different time zone.
Visit https://savvytime.com/converter/utc to view offset
Requirements
Microsoft has introduced a new feature in Excel called Data types. One of the data types is ‘Stocks’. That’s what we will be using for these templates. This feature is available in Microsoft 365 Subscription Plans for PC
-
 SMA Strategy Backtester Google Sheets Template$25
 -
 SMA Strategy Backtester Excel Template$25
 -
 RSI Strategy Backtester Google Sheets Template$25
 -
 RSI Strategy Backtester Excel Template$25
 -
 MACD Strategy Backtester Google Sheets Template$25
 -
 MACD Strategy Backtester Excel Template$25
 -
 Simple Moving Average Stock Screener Google Sheet Template$25
 -
 Stock Screener Excel Template$97
 -
 Simple Moving Average Stock Screener Excel Template$25
For all the templates in this ‘Excel for Stock Market’ series, please visit indzara.com/stock-market-templates
Resources
https://www.tradingview.com/support/solutions/43000502589-moving-average/
https://www.investopedia.com/articles/active-trading/052014/how-use-moving-average-buy-stocks.asp
The foundation of this template is the Stocks Data type and StockHistory function.
Please read more on Stocks Data Type.
Please read more on StockHistory function and how we use to extract the price history of a stock or currency.
Here is the link to the article from Microsoft which shows which exchanges are available and the delay in data refresh for each.
How to refresh?
To refresh the price and other information, just use the regular Excel refresh in the Data ribbon.

Feedback
Please share your experience. I expect this to be different with different exchanges and countries. Is it working for you? Is it working differently? I would love to hear from you.