
Social Media Dashboard – Free Excel Template to report social media metrics
Social Media Dashboard (Excel Template) is designed to consolidate metrics across multiple Social networks such as Facebook, Twitter and YouTube and present in a single-page dashboard. If you are trying to create a monthly view of business impact of content posted across all the social networks by your business, then download this free template to create an instant monthly dashboard.
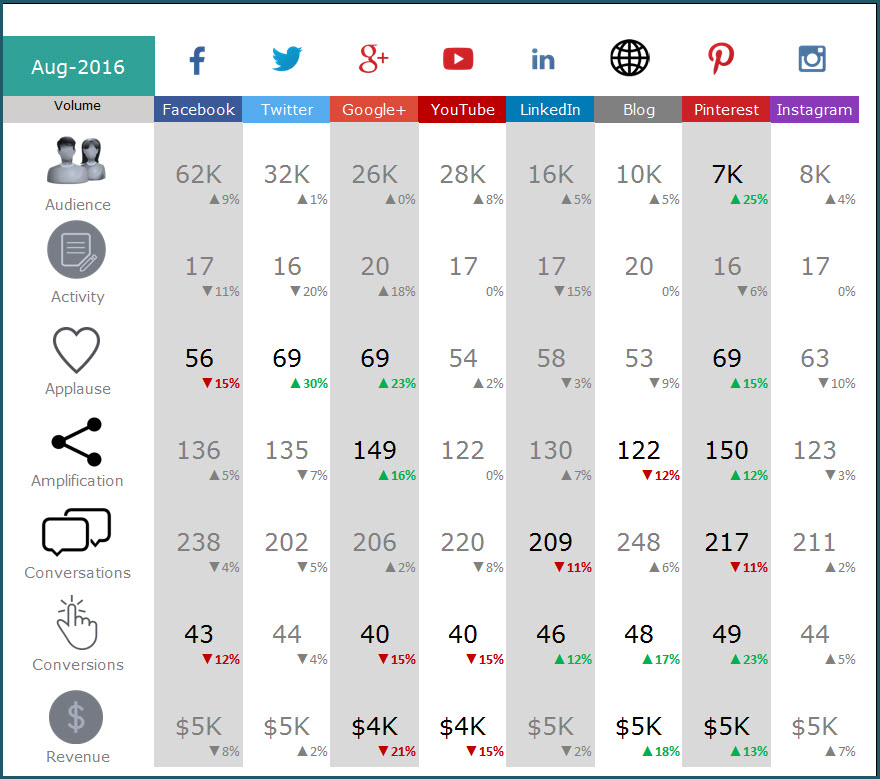
This template does not automate the data collection process. Once we are able to compile the monthly aggregated data from the different social networks, we can use this template to instantly build the dashboard as shown below.
FEATURES OF SOCIAL MEDIA DASHBOARD
The Social Media Dashboard template has the following features
- Add up to 8 social media channels. Choose only ones relevant to your business.
- Designed for Facebook, Twitter, Google+, YouTube, Blog, LinkedIn, Pinterest and Instagram
- 7 social media metrics (Audience, Activity, Applause, Amplification, Conversation, Conversion and Revenue)
- Choose to display metrics as either absolute volumes or rate per activity
- Add each month’s data and store all data in one file
- Automatically calculates Month over Month (MOM) change %
- Control alerts by setting thresholds on each metric
- Alerts highlight only metrics which exceed thresholds (with red or green arrows)
- Dashboard displays large numbers with M (millions) or K (thousands) for better readability
FREE DOWNLOAD
VIDEO DEMO
INSTRUCTIONS (HOW TO USE SOCIAL MEDIA DASHBOARD)
The template is very easy to use.
Step 1: Choose the social networks to include in dashboard
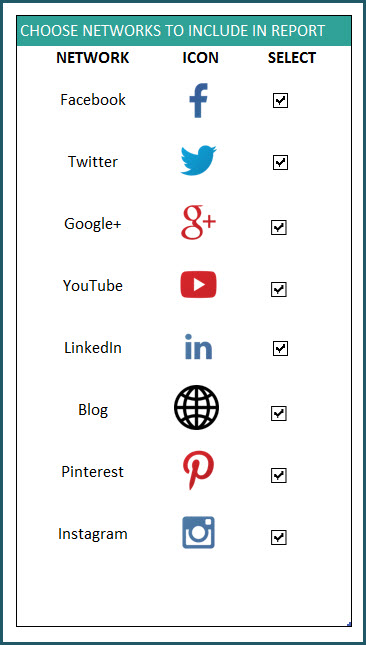
Check the boxes next to social networks you would like to display in the dashboard.
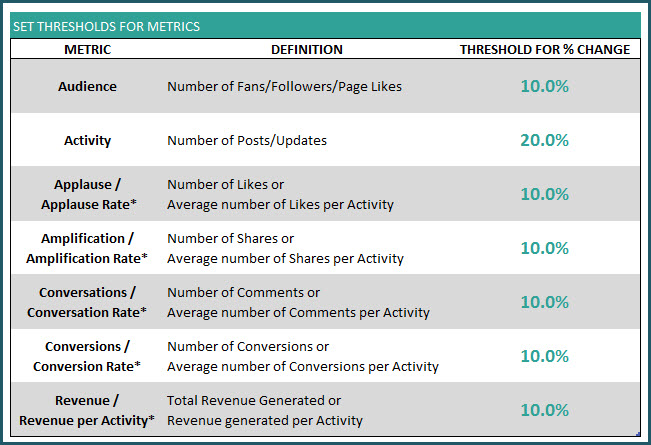
Step 2: Set Thresholds for change in metrics
Before we talk about these thresholds, let’s discuss the metrics the dashboard presents.
- Audience: Number of Fans/Followers/Page Likes (depending on the network)
- Activity Number of Posts/Updates
- Applause: Number of Likes; Applause Rate: Average number of Likes per Activity
- Amplification: Number of Shares; Amplification Rate: Average number of Shares per Activity
- Conversations: Number of Comments; Conversation Rate: Average number of Comments per Activity
- Conversions: Number of Conversions; Conversion Rate: Average number of Conversions per Activity
- Revenue: Total Revenue Generated; Revenue per Activity: Revenue generated per Activity
Recommended read on Social Media Metrics: Best Social Media Metrics – by Avinash Kaushik
Some of these metrics (example: Revenue) may be harder to capture. You may have to get them from your web analytics tool. Each social network (examples: Facebook Insights, Twitter Analytics) allows different levels of access to its analytics data. As mentioned earlier, this template does not address the data collection process. If there is enough interest, please add your thoughts to the comments section below and I will do some research on the data collection process as well.
Why thresholds?
When we display the Month over Month change for each metric, the dashboard can become very distracting with a lot of numbers.
The purpose of the dashboard is to allow us to focus only on metrics that require our attention and action.
So we use thresholds to only flag metrics that exceed our thresholds. Once a certain metric’s month over month (MOM) change exceeds the threshold in positive direction, Green arrows appear on dashboard. If the change exceeds the threshold in negative direction, Red arrows appear on the dashboard.
Here is an example:
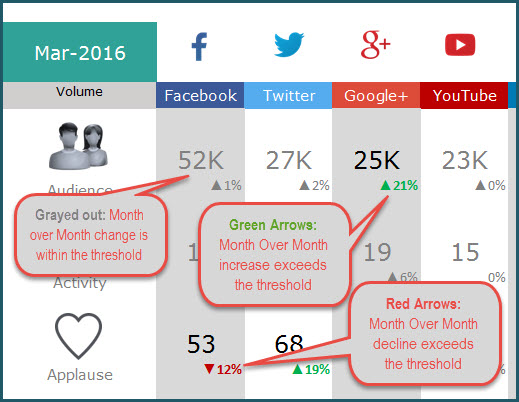
The metrics that are within the thresholds are grayed out so that they do not distract us from the action-required metrics.
Recommended Reads: Tim Wilson’s custom number formatting tip to show arrows and Allen Wyatt’s custom number formatting for Millions and Thousands
Step 3: Enter monthly data for social media channels in DATA sheet
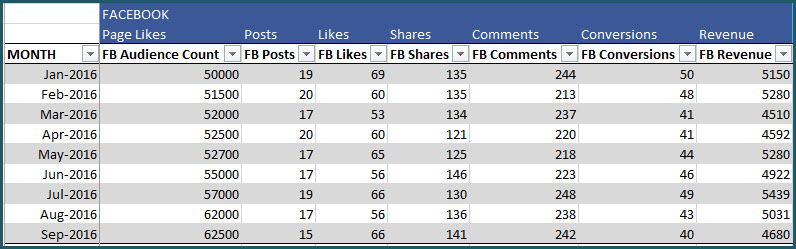
In the DATA sheet, we can enter each month’s data for each social media network.
For example, Facebook data can be entered like this.
Data entry for Twitter data:
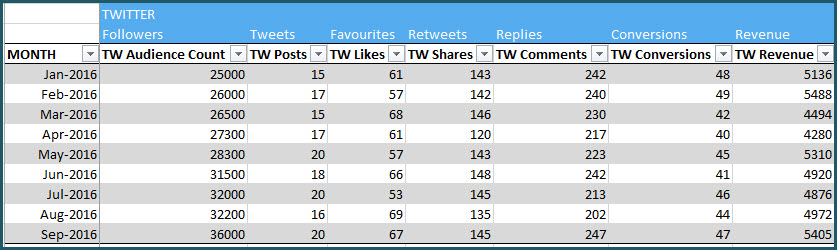
Data for all the 8 social networks are stored in the same table. You can add a new row for each month. (How to enter data in Excel Tables?)
This setup allows you to continue to add any number of months’ data in one place. Thus, you can store a long history of the metrics, all in one file.
Step 4: View DASHBOARD sheet
Now that we have entered our data, we can view the Dashboard in the DASHBOARD sheet.
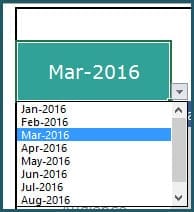
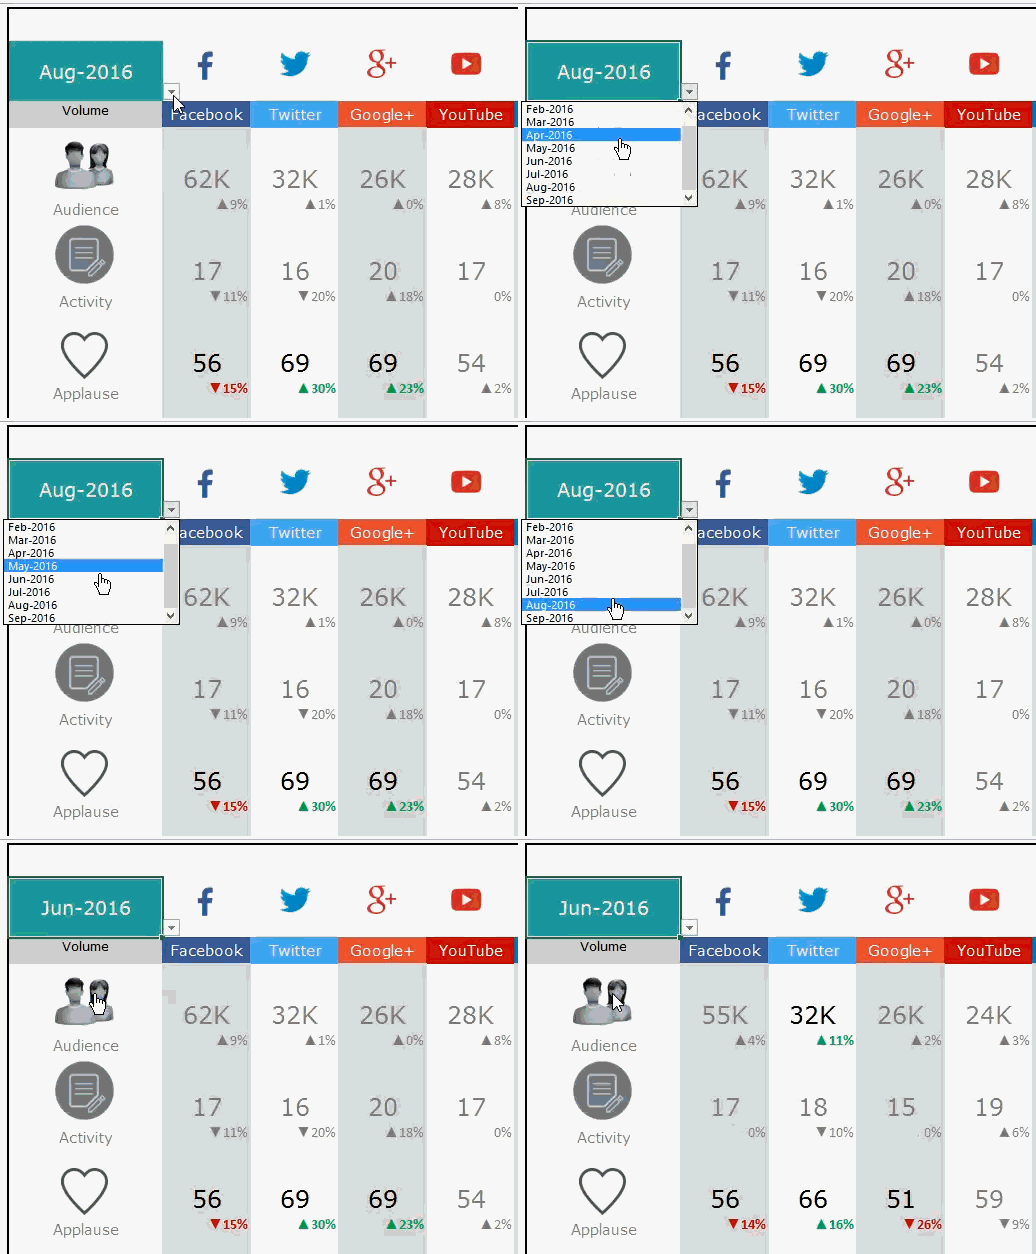
Change Month drop down to view stats for that month
Change Metric type to show absolute volumes or rate per activity
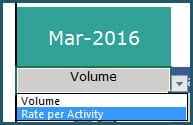
For example, if there are 200 conversations from 10 Facebook posts in Mar 2016, 200 is the absolute volume of Conversations and 200/10 = 20 is the Conversation Rate.
Print or share DASHBOARD sheet as PDF, if needed
The Dashboard sheet is set up as print-friendly. Using the in-built Excel features, we can either print the sheet or export to PDF and share with our colleagues or clients.
If you find the template useful, please share with your friends. If you have any suggestions to improve the template, I would love to hear from you. Please post your thoughts in the comments. Thank you.
95 Comments
Muchas gracias por tan valioso aporte, …saludos desde Lima Perú.
You are welcome. We are glad that our template was helpful.
Thank you for sharing your valuable feedback.
Best wishes.
you doing azamine work We hope that the map will be applied with Dashboard world map
specially I sell services worldwide
Regards
Ahmed Taha
Thank you for showing interest in our template and sharing your valuable feedback.
I have shared the estimation for the customization request in the email.
Best wishes.
Thanks for sharing the useful information. It will be very helpful for us.
You are welcome and we glad that it was helpful.
Best wishes.
Hi – can I get an unlocked version, would like to replace Google+ with TikTok and add a couple additional metrics. this is a great looking start!
Thank you for showing interest in our template.
You can unprotect the sheet using the password indzara.
https://support.indzara.com/support/solutions/articles/62000137281-how-to-unprotect-sheets-
Best wishes.
Thank you for sharing this template which I have downloaded. However, I am facing two issues:
a. Settings Page, the option of ‘selecting/deselecting’ social media plateform is not visible.
b. ‘Dashboard Page’ which is still dated August 2016, is showing ‘Error’ when I haven’t made any amendments.
Is this possible to have another version?
Thanks.
Thank you for showing interest in our template.
Regarding settings page,
The select and deselect option is visible in our end. I have re tested same from Mac and Windows. Hence can you share some screenshot to support@indzara.com and the excel version used along with the OS type.
Regarding date on dashboard,
You can select only the dates that are available in the drop down. The dates for drop-down is populated from the dates entered in column A of DATA table. If you still facing issue on this, please share your copy of the template to support@indzara.com to check further.
Best wishes.
I am a student. My major is Social Media and Web marketing. I have not used your template yet, but I must confess that your teaching methodology is exciting. I want to follow you. I am sure you are the teacher I am looking for. I am still studying this template. I will write from time to time. Thanks, my talented teacher.
Thank you for showing interest in our template and we are glad that you like our template.
Yes, please email us your queries to support@indzara.com and we will be glad to assist you.
Best wishes.
What a great tool! I like everything about it and appreciate your work immensely. I need this to give exact numbers instead of rounding to the nearest 1000(K). Is it possible to change this in the CALC page? Our numbers are pretty small so every number counts right now. If we only have 2,300 on a page I would prefer it not round down to 2K or up to 3K. Can it report it like 2.3K? Any help would be sincerely appreciated.
Thank you for sharing your valuable feedback.
You do not have to edit CALC tab for format change. Requesting to click cells in row 6 which has the mentioned value types on the dashboard and press CTRL+1 to change the format according to your requirement.
Best wishes.
when select month from dashboard, how you link data from data sheet? i click march in dashboard, how do i bring march data in dashaboard? same thing with february, april,…dont see vba, dashboard and data are separate sheets. only see “calc” function when click on cell from dashboard sheet, which not explain anything.
want create a dashboard for myself. thank you kind sir.
Thanks for using our template.
The data is added in the data tab, while the calculation is done in a hidden tab called “Calc”. The data on the dashboard is fetched from there. We have not used any coding in any of our templates to keep them simple and efficient.
Best wishes
Also, I am unable to remove the revenue part from dashboard though I can do it from data sheet! Is there any way to get it done.
Hello
You may hide the rows showing the data that you do not require. Also, you may remove the columns for revenue in the Data tab and remove the data from the Hidden tab, CALC.
Please revert in case you face any issues.
Thanks
Hi Team,
Thanks for the template! Before i use, it would be great if I know how the percentage is being calculated. For instance, Applause Rate, Amplification rate, and more. So that I can be answerable to the stakeholders on the conversion.
Thanks for using our template.
The percentage is based on the difference with respect to the data for the previous month. If you check the sample data and calculate the fields, you can tally the results.
Best wishes
Hello Indzara,
First i want to thank you for sharing this template. However, i observed that this sheet can only have data input from a single page per social platform, which means in my case where i manage multiple pages across different social platforms, I’ll have to duplicate the sheet every single time. So my question; Is there no way, we can have multiple page entries as the data input?
My second question is on the creating a Google version for this? Please how soon can we have that? It will be very helpful especially for collaboration with team members on Google Drive. Pleaseeeee!!!
Thanks for using our template.
This template is designed to track one account for each social media platform. We are in the process of releasing templates compatible with Google sheets.
Best wishes
Hello
May I know if I can change the icon to some other medias?
Thank you
Thanks for your message.
You can change the icons by unprotecting the sheets.
Best wishes
Can I just remove the Revenue part of it? Thanks!
Hello
Yes, you can remove the revenue.
Best wishes
Awesome post.
I was adjusting the tables and now the logos for each social media account just look janky and are cut off. Is there a way to easily fix this without having to delete all of the information I’ve already plugged into the spreadsheet?
Thanks for using the template. The data should not impact the logo images. Please email file to support@indzara.com. We can review and get back to you.
Best wishes.
Will there be an update template for 2019?
Thanks for your message.
We do not have any specific date of release for this template.
Best wishes
Can I add another social media platform? Or Google Ad words analytics?
Hi
This template is not designed for Google Ads yet. We might come up something similar in the next release.
Thanks
Data collection process, please!!!!
Hello
In the DATA sheet, you can enter each month’s data for each social media network.
Thanks
Good morning, can I remove a social media channel that I am not using and, instead, add google analytics?
Thank you!
Thanks for using our template. You may use only the channels that you track. However, Google Analytics cannot add in the tracker now. We might come up with this facility in a later version.
Best wishes
I would love to see a Year-to-Date feature. Is that an option?
Sorry, currently it is only Monthly, as it provides a Month over Month calculation.
Thanks for your feedback.
Best wishes.
how is metric’s month over month (MOM) measured?
The calculations are in the hidden sheet CALC. MOM is (Current Month/ Previous Month)-1
Best wishes.
What about a google sheet template?
Hello
Our templates are designed to work on MS Excel. They are tested on Excel version 2010 and later. You will find many features not working on Google Sheets.
Best wishes
Hello, first of all thank you for sharing the template. It really helps us as a company to get a good overview on our social media. we have a couple of questions though:
Is it possible to compare the stats of our social media to the stats of someone else’s social media in the same file? for instance by copying the data template and filling it in with other information of an other person.
Also, we don’t use some off the networks that are given in the settings (for example, google+ and pinterest). Is it possible to erase them out of the settings and out of the data template? This would be useful because it creates a bit more overview in the template.
Thanks in advance,
R L
Hello
Thanks for using the template.
You may select the platforms on the settings page. However, comparing the competitor’s data is not available now.
Best wishes
How can I change it to get rid of the Conversion rates and the revenue
Please clear the contents of the cells you do not need. Clearing the contents is preferred compared to deleting.
Best wishes.
I was hoping to use ‘Engagement Rate’ instead of Amplification Rate, is this possible? Can I modify the formula somewhere?
If you are referring to just changing the labels, the names of the metrics can be modified directly on the dashboard. If you want to modify the calculations, please use the hidden CALC sheet.
Best wishes.
Is it possible to add more metrics?
Hello,
The number of metrics is capped at 7 now. We may increase it in the next release.
Best wishes
Hi! I would like to use this, but on a Weekly basis not Monthly. Is there a way to change the metric from monthly to Weekly? thanks! Ventura
The template is designed to be modified easily on the time periods. You can change the entries in the Month column to be Week 1, Week 2, etc. Then in Dashboard, you can then choose Week 1 from the drop down.
Best wishes.
I wish there was a guide to show where you go to get all the data to fill in. For example, where you go on fb to see how many likes your posts got for the month. It seems like it will get harder with all the different social outlets.
Hello
Thanks for your feedback.
This feature is not available in the current version. We will definitely try to incorporate this in the future versions.
Best Regards
I wasn’t able to upload this to Google Sheets, and some of my staff don’t have Excel. It breaks on Line 4 of the Data sheet and I get an “Array result was not expanded because it would overwrite data in B12” on the Calc sheet in several cells (where B12 might be a different cell). Any way that Google Sheets can handle this, or no?
Sorry, the template is designed only for Microsoft Excel.
Best wishes.
This is fantastic work. It’s super helpful, thank you! Just one thing: it would be great to have a column measuring ‘reach’ or ‘impressions’.
Thank you. You can rename the labels for the measures. Please use indzara as password for unprotecting sheets.
Best wishes.
Hi, is there a way to change the name of the content columns e.g. from “revenue” to reach? Some businesses don’t have revenue from FB & Instagram but instead focus on reach or page views / engagement. Thanks for your help.
Thank you. You can rename the labels for the measures. Please use indzara as password for unprotecting sheets.
Best wishes.
SO useful. Thanks for sharing this one.
You are welcome. Glad to hear. Thanks & Best wishes.
Hii Indzara…
I want to extract social media reports for commercial purpose…and I do posting of more than 1 company….I want to know how can I link this companies social account to get correct data from each and every accounts…kindly guide me…
Thanks. I don’t have a method to automatically get data from the social media sites. Sorry.
Best wishes.
Hi indzara,
Thanks much for the excellence sharing of the social media on dashboard on excel.
Besides the social media tap into the box. May i know how can i add Website & Apps data into it as well? So i can have the complete analysis!
Thanks a lot!
You are welcome. We have to modify the template to bring other data into this. Sorry, it’s hard to explain here.
Best wishes.
I downloaded the template on my mac and am not able to see the template correctly. I tried to upload it on google drive and still its not the same.
I dont have a windows system. What can i do?
Sorry, the template is not designed for Google sheets.
May I know which version of Excel in Mac? What is not correct? Please clarify.
Thanks.
I need password to change something OMG what is the password lol
Password is indzara
Thanks.
Just what I need. Thank you.
You are welcome. Thanks for the feedback. Best wishes.
really needful and worth working in it .
thanks
Thank you very much for the feedback. Best wishes.
Just incredible. Just what i was looking forward. Thank you very much!!! Very very well done!!!
Quick question is there a easy way to erase all the data you used as an illustration?
Java Jack
Thanks for the feedback. You are welcome.
We have to just select all the cells and press Delete key to remove all the data.
In the DATA sheet, select a cell inside the table and then press Ctrl + A. This will select all the data.
Best wishes.
I need to createa weekly report. Can you guide me how to do this? as I only see this as a monthly report. I would need to add a daily stats to come up with a weekly report. And How can I change it to 2017?
Thanks in Advance
Ghen
The template is set up to store and display monthly metrics. If you enter each week’s results (one row for each week) in the DATA sheet, then the dashboard will work like a weekly report. If you enter each day’s results in DATA sheet, the dashboard will work like a daily report.
It is not restricted by year. Whatever values you enter in DATA sheet, we can pull it through to the Dashboard sheet.
Best wishes.
Hi, whats the difference between FB audience count and FB likes?
Audience Count is the number of users following your profile/account. For FB pages, it is the number of likes to that page. One user is counted only once here.
‘Likes’ represents the number of likes your content (posts) received. One user can give multiple likes to your posts.
I understand that there is room for confusion. If there is a better way to name, please share. Thanks for your feedback.
Superb work..truly awesome !!
Thank you very much. Best wishes.
Thank you for building this!
You are welcome. Best wishes.
This is awesome, is there any possibility to include other social media platforms, I would like to exclude some and include others.
Thank you for building this!
Thank you.
The template is not limited to any specific social media platforms. You can replace the logos and names of the given networks with your preferred. Then, in the Data sheet, you can enter the numbers for the preferred platforms.
Please let me know if there are any questions.
Best wishes.
Truly awesome template. Thank you for sharing. Do you have any plans to add in Reach metrics? Also a KPI tracker? Like one graph, with all the months and a line that shows where the KPI for each month is, and what the actual result for the month was. So you can see growth or lack of, on one chart. Great template.
Thank you very much.
I don’t have a plan yet to update this. I will look for user feedback and decide on most needed features. Your suggestions make sense.
Thanks for taking the time to provide feedback. I will publish here if and when I publish the update. Please stay connected. Best wishes.
This is awesome! such a life saver.. I have been looking for a template to use for 2 years and im so happy to find this! Thank you. What is the standard benchmark or treshold and what does it mean? I would appreciate if you could reply to my email also directly in case i dont get notified of your reply. Cheers! Thank you so much once again.
You are welcome.
Thanks for the feedback. I am not aware of any standard threshold, but I believe it varies by industry and company. You could look at historical performance and then set thresholds accordingly to keep getting better or to reach company’s objectives.
Best wishes.
Nice template. can u tell me how the column are inserted based on the check box. I am quite interesting to know that formula
Please feel free to unhide sheets to see the formula. If password is needed to edit, it is indzara
We take the check box results as 1 or 0. Then we select only the names of the 1s and display in the other sheet.
Best wishes.
nice Excel template. I will surely use it in my job
Thanks for the feedback. I am glad that you find it useful. Best wishes.