2016 U.S. Presidential Election Tracker – Excel Template
It’s election day in the U.S. and almost everyone is interested in knowing the results. Surveys say that more than 80% of U.S. voters are not pleased with the campaigns so far. My opinion about politics continues to go lower and lower with every election cycle (India & U.S.). No, this post is not about my political view. It is about Excel, of course.
A couple of years ago, I wanted to build a tracker during 2014 elections in India, but couldn’t complete it in time. U.S. election system is relatively easier on many aspects. So, here we go. A simple 2016 election results by state spreadsheet template where you can enter the winner of each state and view the results on map. The electoral votes get calculated for each candidate. You can download and edit to apply techniques to other elections or competitions.
It should be noted that I have simplified the framework by only considering 2 candidates/parties (though there are others on ballot).
FREE DOWNLOAD
VIDEO DEMO
HOW TO USE THE U.S. ELECTION TRACKER TEMPLATE
All the states (and D.C.) are listed on the left side.
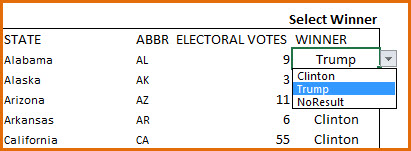
The electoral votes for each state are also listed.
Please choose the winner of each state. Select Clinton, Trump or NoResult.
On the right side, you can see the results update.
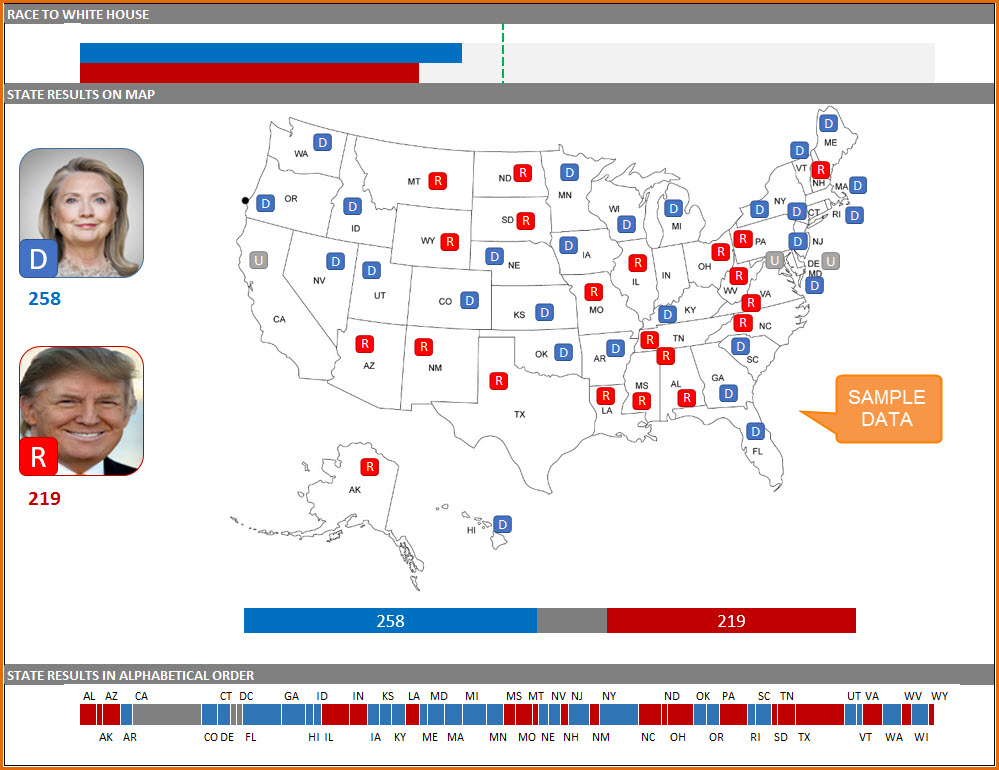
At the top is the Race to White House.

The bars in the 2016 election results excel template represent the electoral votes won by each candidate and they increase as the candidates win states. Red color is for Republican party (Trump) and the Blue for the Democratic party (Clinton). The Green line is the magic 270 mark which is needed to become President.
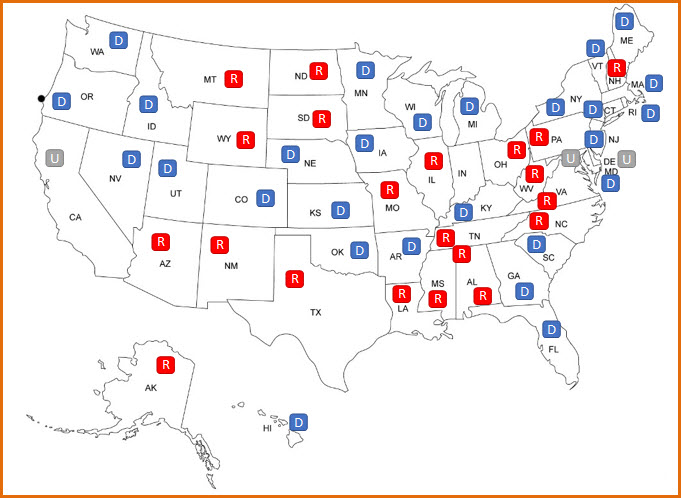
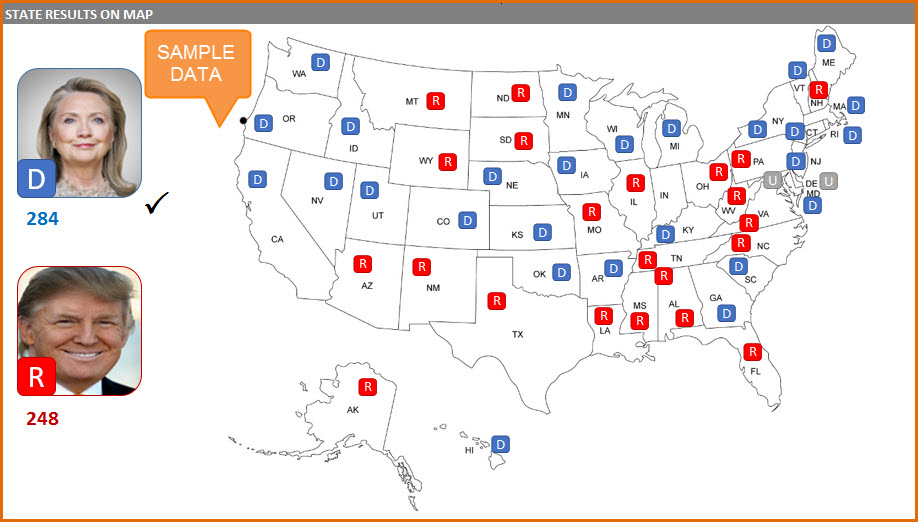
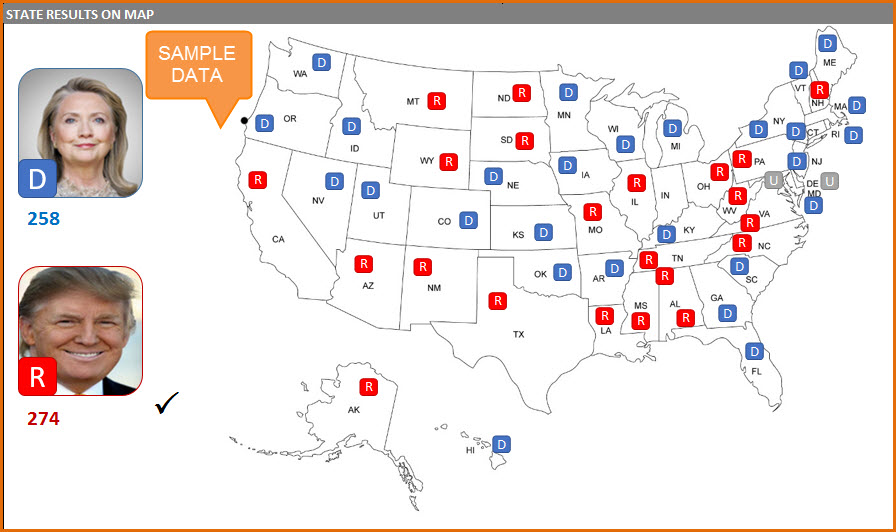
Then, we have the map view.
The Initial D (Democrat) or R (Republican) represents the party that won the state.
The candidates’ total electoral votes are also shown.
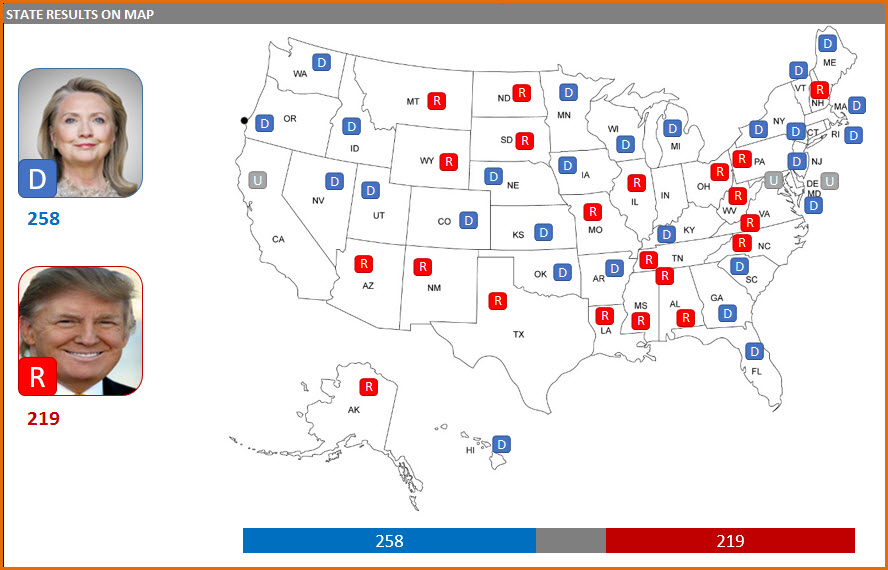
When the candidate’s total touches 270, we can see the winner. I don’t have the right to vote and am not picking any sides here. So, let’s see winning scenarios for both parties. 🙂
A completely random scenario where Clinton wins.
Here is a random scenario for Trump’s win.
At the bottom we have the state results in Alphabetical order.
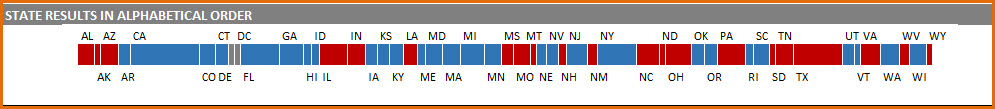
The width for each state is proportional to the electoral votes.
If you would like to edit the formulas in this 2016 presidential election results excel template, please unprotect the sheet using indzara as password.
Please share this with your friends if you like the templates available on this site.
Data Visualization & Analytics Templates
14 Comments
Thanks for putting this together and for sharing the ways to update it. I’m ready to go with fingers crossed for USA 2020!
Hi There!! I love this template — thank you so much for creating it!!
I am having a hard time with the map part. The images resized when I opened this template on my computer in the map area specifically. I changed up the pictures (Biden instead of Clinton and a current Trump image) but the initials (U, D, R) resized and the only visible part are the top left corner of each image and I’m not able to resize them. I tried resizing and cropping; also inserting new ones and trying the formulas immediately visible on them – nothing worked though. I’m sure the solution is there but I’m having a hard time finding it — any suggestions would be greatly appreciated.
Thanks!!!
Thank you for using our template.
Our support team will respond to your concerns shortly.
Best wishes.
I changed Clinton to Biden and most of it works as expected, except the bottom line showing the states where it will not show blue for Biden, only white.
How is this set? I was unable to find where it is controlled.
I found it myself. Conditional formatting. Sorry for bothering you.
No Issues
Thanks
It’s strange you haven’t updated the spreadsheet & page screenshots with the actual election results after almost 4 years. You have Clinton winning 4 out of 5 times and your download, too!??? I was hoping for a finished product. Please update and maybe add the split votes in Maine.
Thanks.
The template was published to illustrate how one can enter data and visualize such a scenario. It was not meant to reflect the results as it was published before the results were announced.
Thanks for your feedback. We will update the data.
Best wishes.
Your YouTube video has a “Help” sheet, but the template I downloaded doesn’t. Am I missing something? I’d like to change “Clinton” to “Biden” and maybe change the photo.
Awesome template, by the way. An incredibly powerful free tool.
Sorry, rewatched the video and figured it out. However, when I change “Clinton” to “Biden” on the “Help” sheet, the blue bar above the map disappears and the dropdown menus don’t change. I’m pretty much an Excel novice, so a lot of this is over my head.
Thanks.
If you type Biden in cell C3 (where Clinton was), the drop down in 2016_US_ELECTION_TRACKER sheet in the ‘WINNER’ column will now allow Biden. Once you choose Biden for some states, they will be reflected in the ‘race to white house bar’.
Then, go to name manager (Ctrl+F3 or Name Manager in Formulas ribbon). Edit the named range named as Clinton. Replace the name as Biden. This will make the D vs R stickers/labels on the map now accept Biden’s name.
If you have any questions, please email us at support@indzara.com with the file.
Best wishes.
You are welcome. Thanks for the positive feedback.
I have explained the steps in the other comment in response.
Best wishes.
there is a password needed to edit the template
Please use indzara as password. Thanks.