Project Pipeline Tracker 2023 – Free Excel Template
This Excel template allows tracking projects and calculating effectiveness in completing them. This is applicable for scenarios where all the projects go through the same set of pre-defined stages in sequence.
In a simple example, each building project may have three stages: Plan – Design – Build. Once planning is completed, designing begins and after designing is completed, build begins. We will be tracking the completion of each stage of each project.
It is very simple to use. It can provide visibility to how long it takes for our projects to complete. It can also help identify where the bottlenecks are in our project cycle. We can also view the trends in terms of time each stages takes.
Free Download
REQUIREMENTS: Microsoft Excel for Windows (2010 or above); Microsoft Excel for Mac (2011 or above);
Video Demo
How to track project pipeline in Excel?
The template has only 3 visible sheets. In the Data sheet, we enter our input data and the Active Pipeline sheet and Report sheet have output that is automatically calculated. The Data sheet also has a summary of metrics.
Enter stages
By default the template has 6 stages (including the final closing stage).
We can rename those stages to meet our business needs. Also, we can remove stages if we don’t need 6. To remove 6th stage, just click on the 6th stage name and press Delete key.
Enter Projects
Enter each project in a separate row in the Projects table.
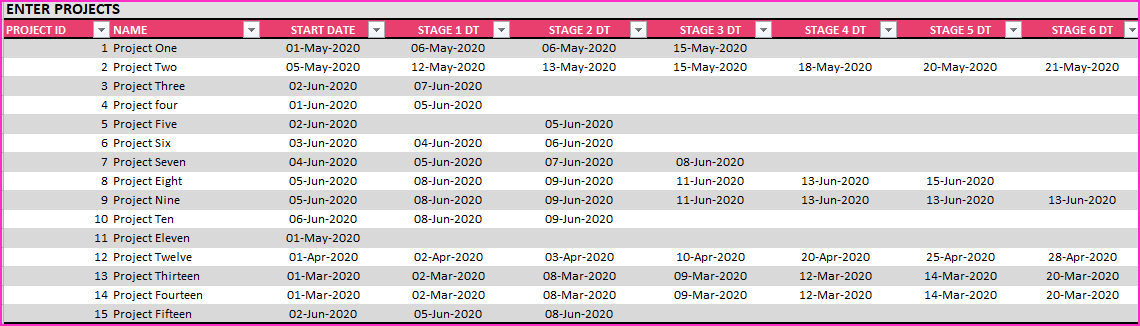
Enter Project ID and Name. Then, enter Start Date of project. The next 6 columns are dates of completing each stage of project.
These Stage DT fields should not be renamed.
The two columns (Type, Owner) are optional and can be used to store other information as you need. These can be renamed.
The last four columns in the table are calculated and should not be edited.
- CURRENT STAGE Based on the dates entered for each project, the current stage will be displayed. If the project has completed the final stage, then it will display COMPLETED.
- COMPLETION DATE If the project has completed the final stage, then that date will be displayed.
- DURATION (DAYS) If the project is completed, the duration from Start Date to Completion Date. If the project is not completed, this is the duration from Start Date to Today.
- VALIDATION The template checks for a couple of errors. If the dates entered for each stage are not sequential or if there is a date missing in between stages, ERROR will be displayed. Error projects are not included in metric calculations.
Output
Completed Projects – Summary
We can see an instant summary of the completed projects as we enter data. Number of completed projects and how long on average a project takes.
We also see how long each stage takes to complete.
Active Pipeline – Summary
The number of projects that are currently being worked on and how many projects are currently in each stage are shown.
Active Pipeline – Details
We can also see the detailed Active pipeline in the Active Pipeline sheet.
Here we can see the (up to 5) projects in each stage as well.
The ID, Type and Owner fields are displayed. Even if you rename the fields and use them to store other type of information, they will be displayed in this Active Pipeline sheet. Thus, it can be modified to your business needs easily.
Report
The Report sheet presents the metrics (Projects Completed, Average Project Duration and Average Duration for each stage) for the past 12 months.
The information is also presented visually so that we can see how the duration vary over month for each stage.
Editing the template
- The Active Pipeline and Report sheets are locked with password (indzara) to prevent accidental editing of formulas. You can unprotect them and make edits if needed. Unprotecting sheets
- Data sheet is not locked. You can edit the shapes and charts as needed as well.
This is the first version of this template. There are many different directions that we can take this template further. As always, I look forward to feedback and suggestions to make this more useful to a lot of people. I will do my best to implement additional features and enhance the template.
For more project management templates, please visit Project Management Excel Templates
Related Excel Templates
- Project Planner Excel Template – Free
- Free Task Manager Excel template
- Earned Value Management in Excel
- Calendar Excel Template
Recommended Templates
-
 Project Management Toolkit Excel TemplatesOriginal price was: $200.$100Current price is: $100.
 -
 Resource Capacity Planner Excel Template$50
 -
 Gantt Chart Maker Excel TemplateOriginal price was: $25.$20Current price is: $20.
 -
 Project Manager Excel TemplateOriginal price was: $40.$35Current price is: $35.
 -
 Project Planner (Advanced) – Excel Template$30
 -
 Excel Calendar Template – Excel Calendar 2025/2024 or any yearOriginal price was: $25.$20Current price is: $20.
 -
 Task Manager (Advanced) – Excel Template$45
58 Comments
Great template, would like to discuss hiring you to make changes to fit our specific needs. Is this something you are interested in?
Thank you. I have replied to your email.
Best wishes.
Hi,
Its a good template ,now the thing is if I have 10 stages for my project , how can I add more stages and you should have some budget calculation in your template.
Thanks. It would require modifying formulas in hidden sheets and the visible sheet. For budget calculations, please see Project planner https://indzara.com/product/project-planner-advanced-excel-template/
Best wishes.
Dear Mr. Indzara
I hope my email find you well.
I would like to thank you for your great page and excellent Excel sheet that you always do.
I would like you to assist me with your project pipline tracker template. I know that DT should not rename as you mentatin in your page as will as word completed in the current stage and error and no error in the validation stage, but acullty I need to rename the whole template to Arabic could you please advise me on how I can change those things to Arabic.
Thanks in advance
Best Regards
You are welcome.
I have not had a chance to translate the entire template to another language. If you try, please share your experience here. If there are specific questions, I will be glad to help.
Best wishes.
First of all, thanks for your tremendous effort. These templates are terrific.
On the project pipeline tracker template, is there a way to hide (or preferably delete) columns that I’m not interested in (e.g. Validation, Type, Owner, Project ID).
Actually, it would be nice to even hide the Stage DT columns to reduce clutter.
Thanks.
You are welcome. Thanks for feedback.
Please do not delete any columns. You can hide them as needed. Just right click on the column header (at top) and choose Hide.
Best wishes.
Excel 2013
Thanks for your email confirming that everything is working as expected, after you restarted your PC. Thanks.
Hello, when I open the file I get a message stating “there are problems with some contents. Do you want to recover as much as we can?” When I say yes, all of the images disappear and the file becomes a ‘repaired’ file. When I open the file in protected view, the images are visible. Please advise.
Please let me know the version of Excel you are using and if it is Mac or PC. If you could send me screenshots of the error and the file after saving, that would help as well. Thank you.
Hi There — Is there a way to change the metric for the project from days to weeks?
Yes, it is possible. It would require some changes to the formulas. Please feel free to edit. If you would like help, please email at indzara@gmail.com and I take projects for a fee. Thanks. Best wishes.
Hi – this looks to have some potential for us. We outsource all of our metal fabrication to mostly one vendor. I am trying to track the following. Po issued, fab drawings rec’d, fab dwgs to customer, fab dwgs approved, requested ship date, and ship date. My problem comes with requested ship date. I want to dictate the ship date when I issue my PO, using standard lead times we have established. Is there a way to do this using the pipeline? I also looked at the project management template for this – perhaps that is the better option. The pipeline just looked simpler and right to the facts!
Thank you. You are correct. This pipeline tracker is designed to track actual dates, and not expected dates based on standard lead times. We can build expected lead time concept into this if needed. We would need to know more details such as 1) whether there are standard lead times for all stages or just one (ship date), 2) Is it possible to miss the standard lead times? 3) is the goal to track actual dates and then compare with expected/standard dates to assess compliance? I take on customization projects for a fee. if you are interested in a customized solution, please email indzara@gmail.com with specific requirements on input and output. I will be glad to review and provide feedback. Thanks. Best wishes.
Minor really, but template seems to require Agency FB font – this might be an issue for business users who cannot install non-default fonts. The template as downloaded, without Agency FB, looks somewhat untidy (off centre headings, obscured heading etc).
Good functionality once you watch the video, and understand why the chart disappears if you delete the sample data… 🙂
Thanks for the feedback. I realized this just a few days ago and had made one with default font. I have replaced the file in this post above with the new file. Please try and let me know if there are any issues. Thanks & Best wishes.
Hi there, Very nice template and excellent view. Quick Questions though:
Q1) In the “data” tab I am adding in additional projects name after Project 15 but the moment I do that, the “Active Pipeline” count is reduced to 1 from 9. Not sure why is that happening? Please advise.
Q2) On Project Five, I still get “Error” even when I input date in Stage 1 DT? Would you know how can I correct it?
Q3) In the “Active Pipeline” tab, I can only see upto 5 project count, how should I increase to view all based on the data entered. I want to make this as per projects entered?
Your support is much appreciated.
Regards,
Anupam
Thank you.
Q1: Have you edited the stages or any of the formulas? Please let me know, as when I add projects it works fine. Even in the video demo above, I do that.
Q2: If the date entered in Stage 1 is greater than stage 2 or less than start date, it will still be an error. Please check.
Q3: To show more than 5 projects per stage in active pipeline report, please edit formulas in hidden H sheet (columns E to P) and then add rows with formulas in Active Pipeline sheet.
If there are further questions please email the file and highlight questions.
Best wishes.
Hi,
How do I edit formulas to view more than 5 projects? Am unable to edit formulas in hidden H sheet (columns E to P) and then add rows with formulas in Active Pipeline sheet.
The Active Pipeline sheet is protected. You can unprotect with indzara as password.
Please let us know if there are any questions.
Thanks & Best wishes.
Answer to your Q1, Anupam
the “Active Pipeline” count is reduced to 1 from 9 because the tab just needs to be stretched in the width, it’s a number 10 but you just can’t see the zero.
Hope this helps.
Great
Excel Template by the way working great.
Thank you