Project Pipeline Tracker 2023 – Free Excel Template
This Excel template allows tracking projects and calculating effectiveness in completing them. This is applicable for scenarios where all the projects go through the same set of pre-defined stages in sequence.
In a simple example, each building project may have three stages: Plan – Design – Build. Once planning is completed, designing begins and after designing is completed, build begins. We will be tracking the completion of each stage of each project.
It is very simple to use. It can provide visibility to how long it takes for our projects to complete. It can also help identify where the bottlenecks are in our project cycle. We can also view the trends in terms of time each stages takes.
Free Download
REQUIREMENTS: Microsoft Excel for Windows (2010 or above); Microsoft Excel for Mac (2011 or above);
Video Demo
How to track project pipeline in Excel?
The template has only 3 visible sheets. In the Data sheet, we enter our input data and the Active Pipeline sheet and Report sheet have output that is automatically calculated. The Data sheet also has a summary of metrics.
Enter stages
By default the template has 6 stages (including the final closing stage).
We can rename those stages to meet our business needs. Also, we can remove stages if we don’t need 6. To remove 6th stage, just click on the 6th stage name and press Delete key.
Enter Projects
Enter each project in a separate row in the Projects table.
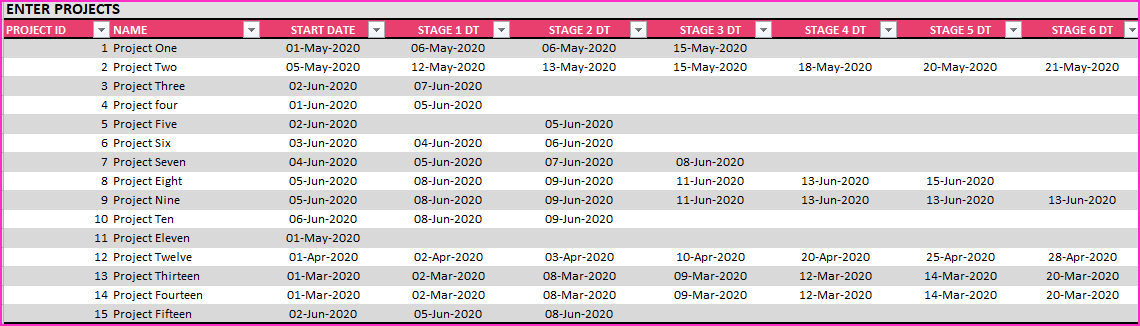
Enter Project ID and Name. Then, enter Start Date of project. The next 6 columns are dates of completing each stage of project.
These Stage DT fields should not be renamed.
The two columns (Type, Owner) are optional and can be used to store other information as you need. These can be renamed.
The last four columns in the table are calculated and should not be edited.
- CURRENT STAGE Based on the dates entered for each project, the current stage will be displayed. If the project has completed the final stage, then it will display COMPLETED.
- COMPLETION DATE If the project has completed the final stage, then that date will be displayed.
- DURATION (DAYS) If the project is completed, the duration from Start Date to Completion Date. If the project is not completed, this is the duration from Start Date to Today.
- VALIDATION The template checks for a couple of errors. If the dates entered for each stage are not sequential or if there is a date missing in between stages, ERROR will be displayed. Error projects are not included in metric calculations.
Output
Completed Projects – Summary
We can see an instant summary of the completed projects as we enter data. Number of completed projects and how long on average a project takes.
We also see how long each stage takes to complete.
Active Pipeline – Summary
The number of projects that are currently being worked on and how many projects are currently in each stage are shown.
Active Pipeline – Details
We can also see the detailed Active pipeline in the Active Pipeline sheet.
Here we can see the (up to 5) projects in each stage as well.
The ID, Type and Owner fields are displayed. Even if you rename the fields and use them to store other type of information, they will be displayed in this Active Pipeline sheet. Thus, it can be modified to your business needs easily.
Report
The Report sheet presents the metrics (Projects Completed, Average Project Duration and Average Duration for each stage) for the past 12 months.
The information is also presented visually so that we can see how the duration vary over month for each stage.
Editing the template
- The Active Pipeline and Report sheets are locked with password (indzara) to prevent accidental editing of formulas. You can unprotect them and make edits if needed. Unprotecting sheets
- Data sheet is not locked. You can edit the shapes and charts as needed as well.
This is the first version of this template. There are many different directions that we can take this template further. As always, I look forward to feedback and suggestions to make this more useful to a lot of people. I will do my best to implement additional features and enhance the template.
For more project management templates, please visit Project Management Excel Templates
Related Excel Templates
- Project Planner Excel Template – Free
- Free Task Manager Excel template
- Earned Value Management in Excel
- Calendar Excel Template
Recommended Templates
-
 Project Management Toolkit Excel TemplatesOriginal price was: $200.$100Current price is: $100.
 -
 Resource Capacity Planner Excel Template$50
 -
 Gantt Chart Maker Excel TemplateOriginal price was: $25.$20Current price is: $20.
 -
 Project Manager Excel TemplateOriginal price was: $40.$35Current price is: $35.
 -
 Project Planner (Advanced) – Excel Template$30
 -
 Excel Calendar Template – Excel Calendar 2025/2024 or any yearOriginal price was: $25.$20Current price is: $20.
 -
 Task Manager (Advanced) – Excel Template$45
58 Comments
Hello this spreadsheet is great… is there any way of saving it so it can be shared to allow multiple users to access/edit at the same time?
Thanks Justin
Thanks for your feedback.
You can download the template from the download section at https://indzara.com/2016/06/project-pipeline-tracker-free-excel-template/.
You may share the file among your team members, but only one member can update it at a time.
Best wishes
Hello, would you assist me on adding a new stage or phase we have 7 phases now under Ideation and Initiation Phase? Thanks a lot.
Hello
You can unhide the H sheet and add stages. However, please ensure that the added stage reflects on all the sheets.
Best wishes
Tried to edit the Internal / External Type column with my own list, but it does not work..
Thanks for emailing us. We have responded to your email addressing your questions.
Best wishes.
Dear Mr. Indzara ,
I’m a small start up developer and you’ve helped me a lot with this template. I very much appreciate and thank you for the work you’ve done. I just need help with adding more boxes on the ACTIVE PIPELINE Sheet so that I can better track the projects. Please do advice.
Thank you once again!
Best Regards,
Michael
Hello
Please note that there is a hidden sheet H where calculations are done which drive the Active Pipeline sheet. We have to first add more rows in the hidden sheet with calculations and then extend the formulas in the Active Pipeline sheet.
Best wishes
Hello,
I would like to reset the data for reach month rather than it accumulate over the year. For example: I don’t want the number of completed projects in April to be present when looking at the May project pipeline. However, I do want to keep all the monthly data in the reports. Is there a way to do this?
Thank you.
We would have to adjust the formulas. Please feel free to edit the formulas to calculate only for the current month.
Best wishes.
Hi there,
Do you happen to have a veriosn of this to use in Google Sheets? Thanks!
Hello,
Our templates are designed to perform best under single user environment. Many features will not work in Google Sheets.
Best wishes.
Hi I really like this tracker. Can I add columns?
Thanks
Hello
Thank you for using the template.
Please advise if you wish to add a stage or a column for calculation.
Best wishes
Thank you for sharing this template, would like to add stages. Kindly advice.
Hello
To add a stage, the hidden sheet needs to be edited and stages added. The formula should be edited as well.
Best wishes
I’m a civil engineer, and it was very very useful for me. thanks you for the support and for this great work.
Glad to hear that it is useful. Thanks for feedback.
Best wishes.
I’m trying to download the project pipeline tracker via my iPad but doesn’t seem to be working.
Thanks for interest. I am sorry that I have not tested with iPad.
Best wishes.
I am unable to understand how you get a 6th or more project to show up in each stage, specifically the Initial Stage or my Stage 1. Also, having some issues with it calculating past the Stage 1. It will calculate if you go to Stage 6 but if you stop before it does not calculate.
Thank you,
If you are referring to the Active Pipeline sheet, please note that there is a hidden sheet H where calculations are done which drive the Active Pipeline sheet. We have to first add more rows in the hidden sheet with calculations and then extend the formulas in the Active Pipeline sheet.
If there are further questions, please email file to support@indzara.com
Thanks & Best wishes.