Home » Data to Decision » Page 2
Category: Data to Decision
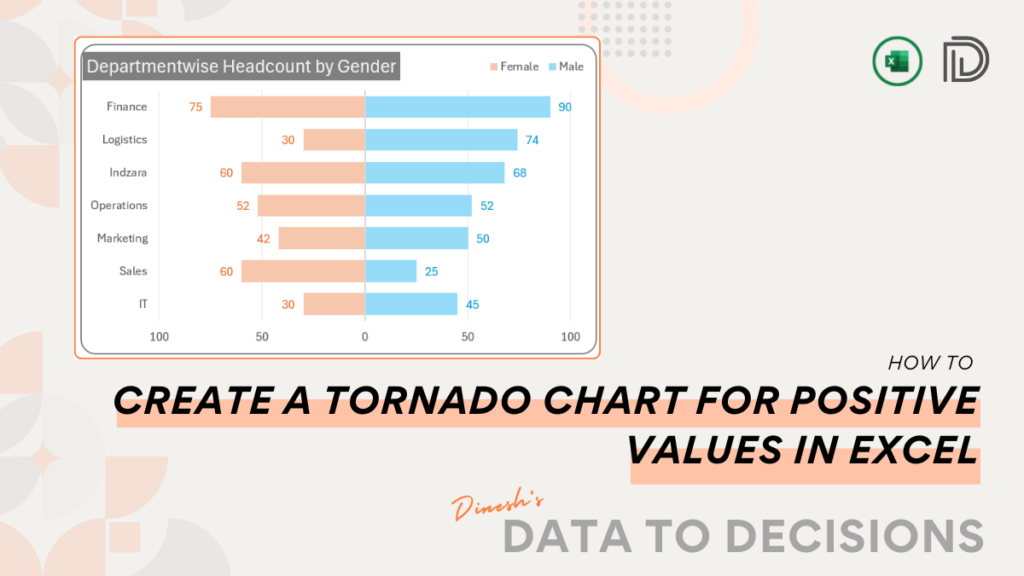
Learn how to create a tornado chart in Excel with our step-by-step post. Perfect for comparative analysis, create this chart
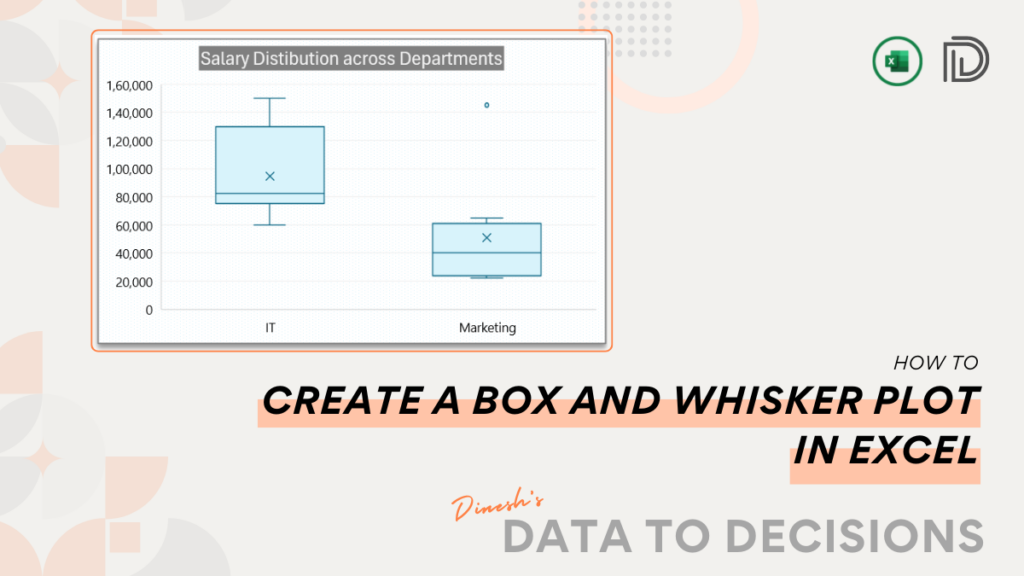
Learn step-by-step how to create a dynamic Box and Whisker Plot in Excel to visually identify the distribution of your
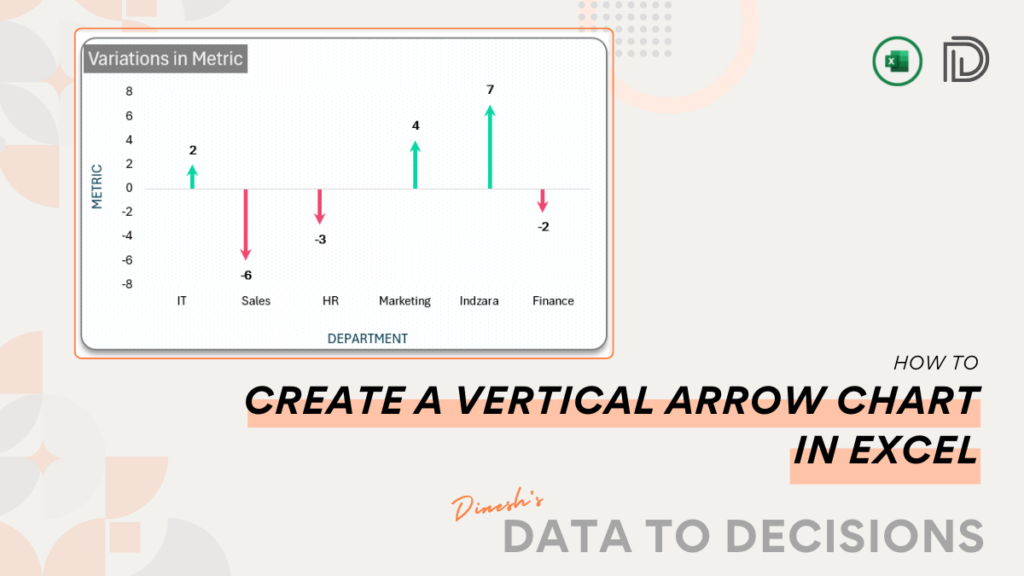
Discover how to create a vertical arrow chart in Excel with our comprehensive blog post, featuring clear step-by-step instructions.
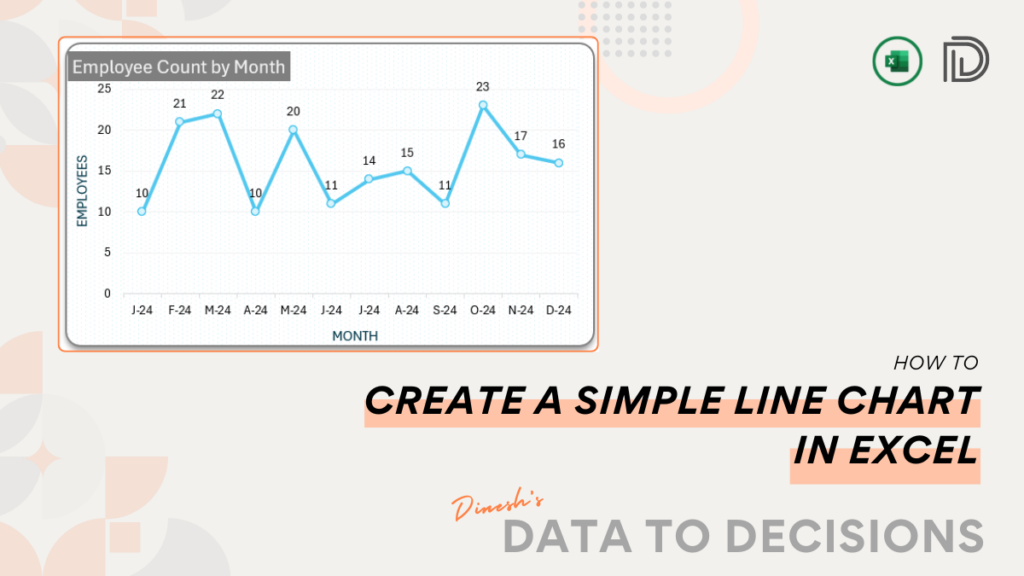
Learn how to create a simple line chart in Excel with our easy-to-follow guide, complete with step-by-step instructions and screenshots.
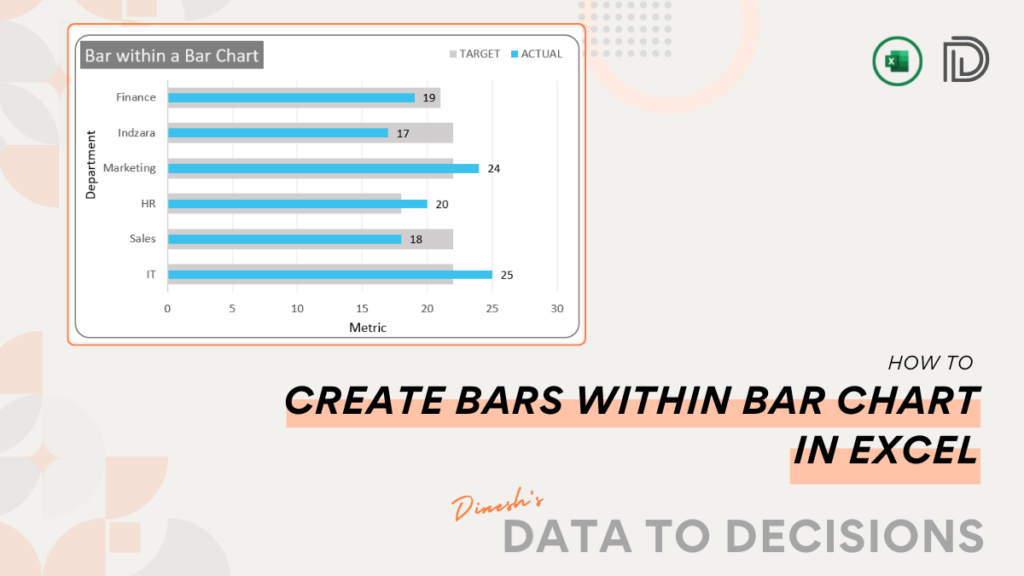
Discover how to create a bar within a bar chart in Excel for detailed data comparison like target versus actuals.
Learn how to create a 100% stacked bar chart with totals in Excel to visualize the composition in your data
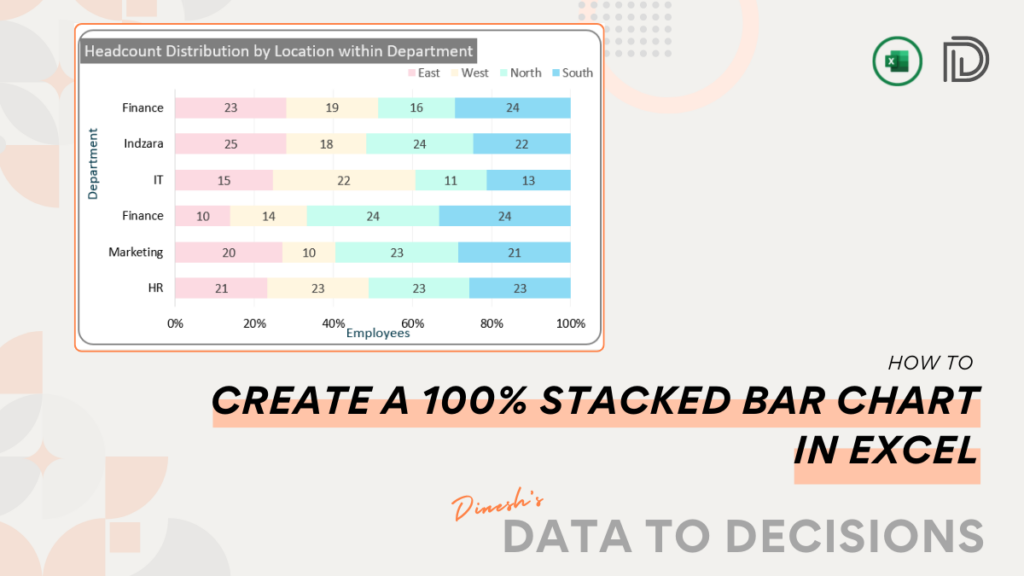
Learn how to create a 100% stacked bar chart in Excel to visualize compositions in your data instantly with this
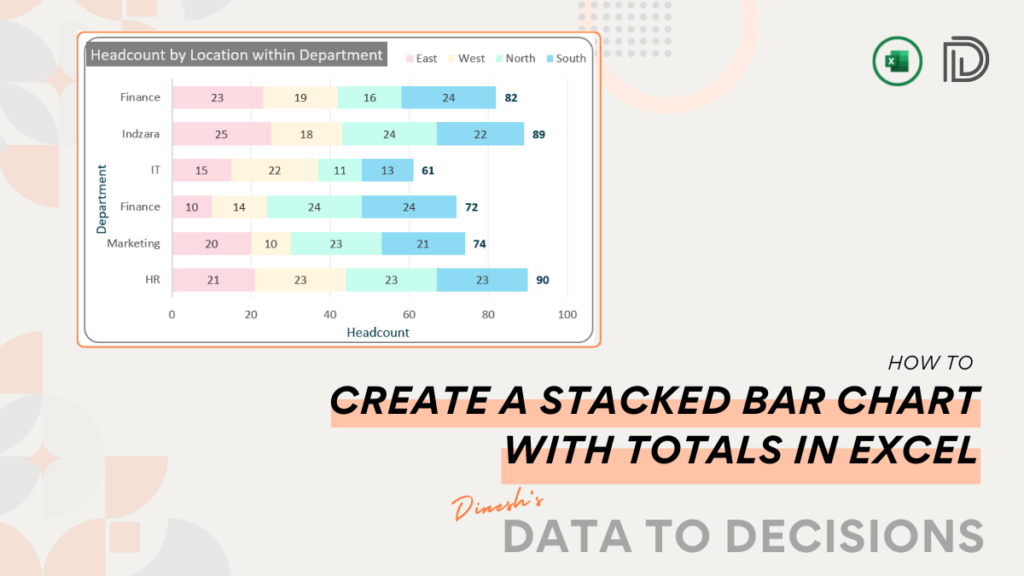
Learn how to create a stacked bar chart with totals in Excel for effective data comparison and visualization in simple
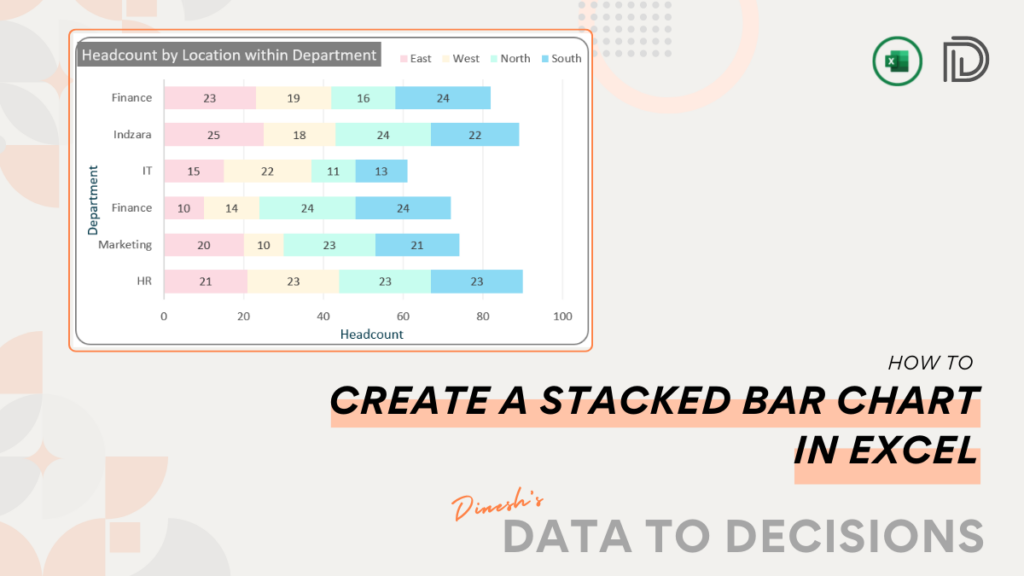
Learn how to create a stacked bar chart in Excel for effective data comparison and visualization in simple steps.
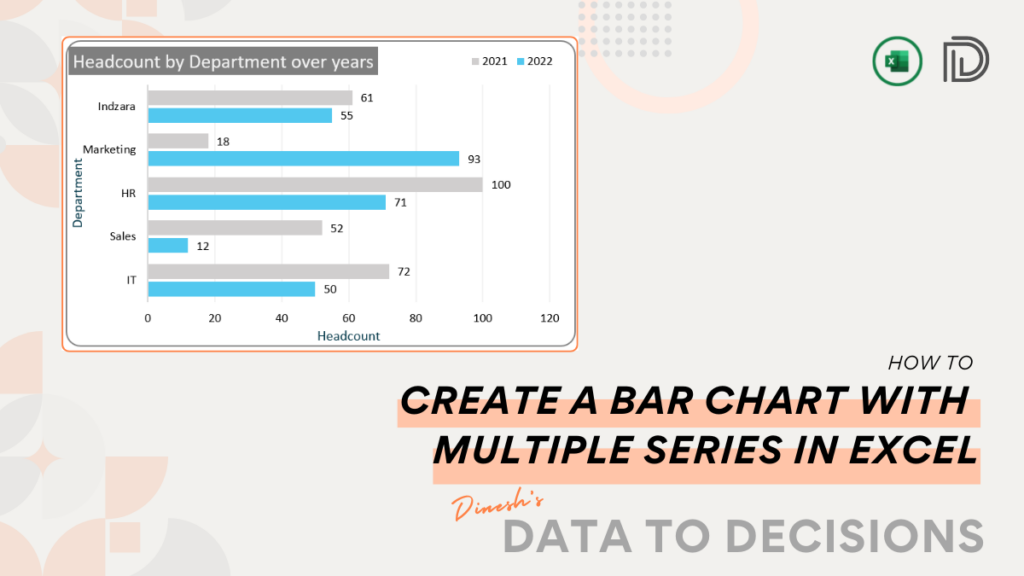
Learn how to create a dynamic bar chart with multiple data series in Excel for clear and compelling data visualization.

