Home » Data to Decision » Visualization » Page 2
Category: Visualization
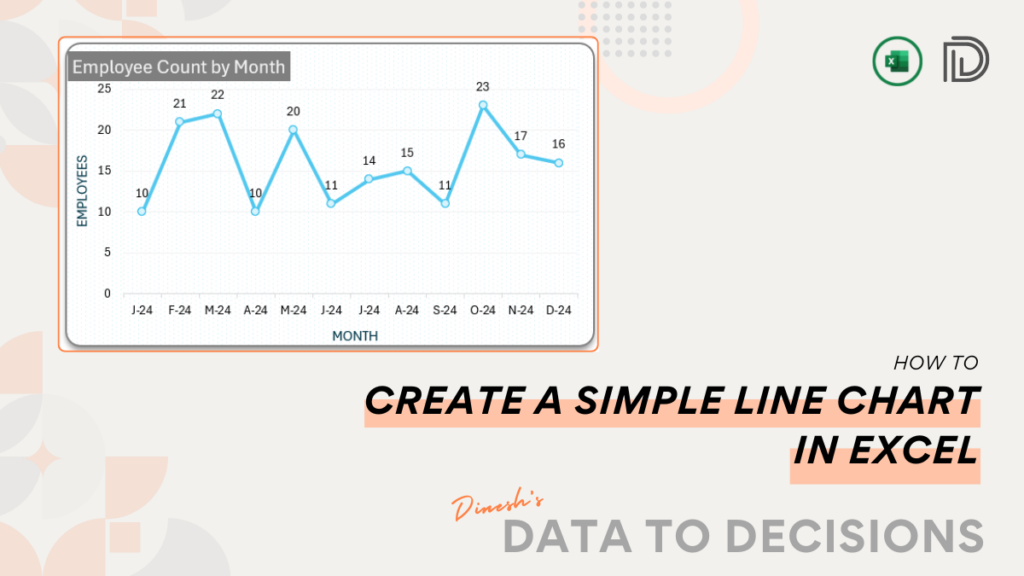
Learn how to create a simple line chart in Excel with our easy-to-follow guide, complete with step-by-step instructions and screenshots.
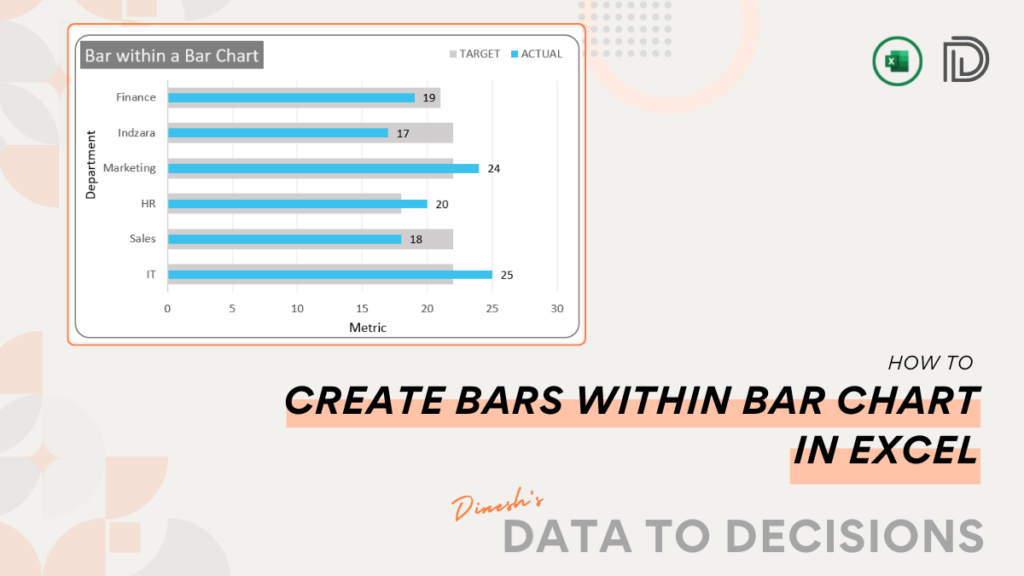
Discover how to create a bar within a bar chart in Excel for detailed data comparison like target versus actuals.
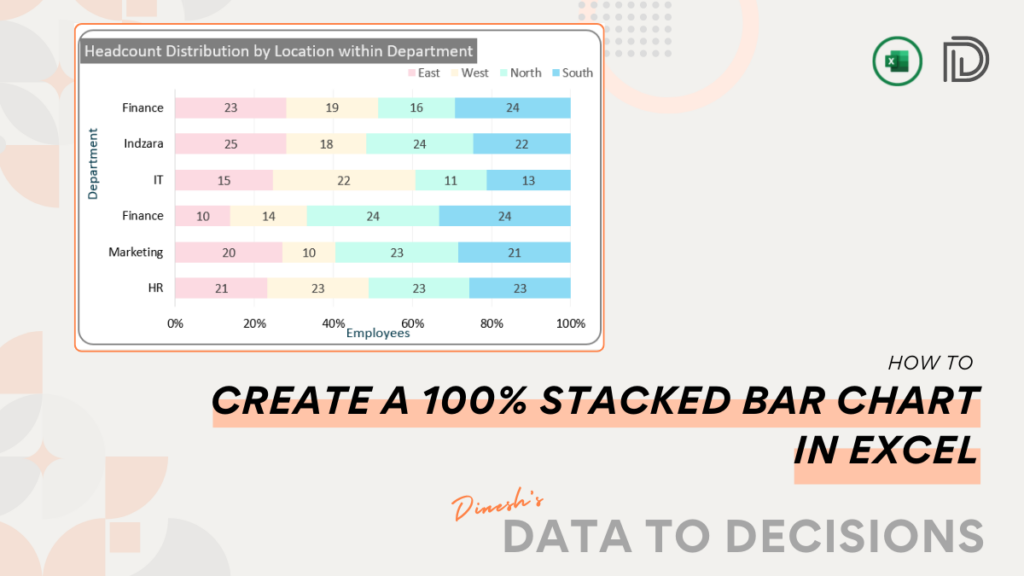
Learn how to create a 100% stacked bar chart with totals in Excel to visualize the composition in your data
Learn how to create a 100% stacked bar chart in Excel to visualize compositions in your data instantly with this
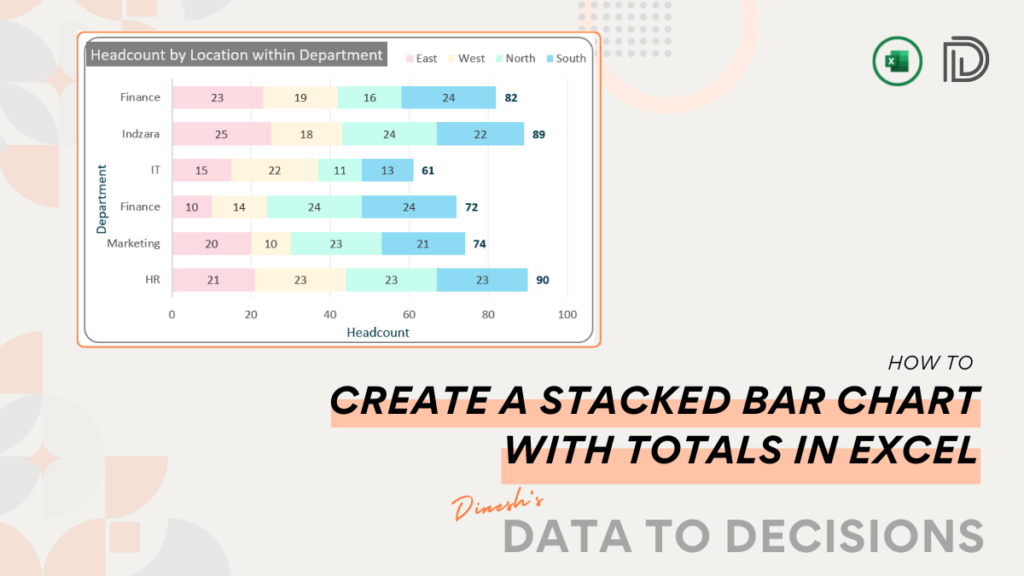
Learn how to create a stacked bar chart with totals in Excel for effective data comparison and visualization in simple
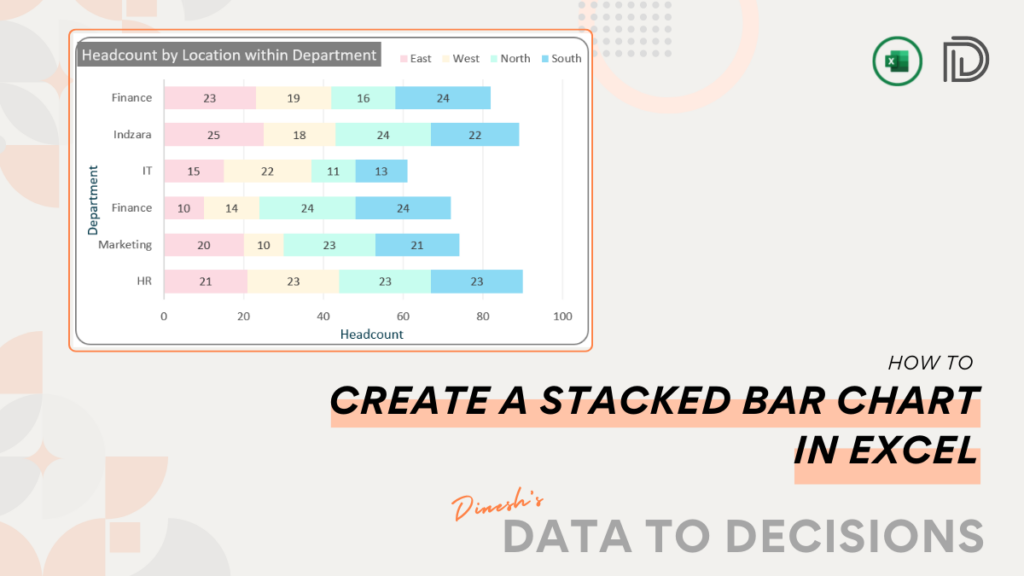
Learn how to create a stacked bar chart in Excel for effective data comparison and visualization in simple steps.
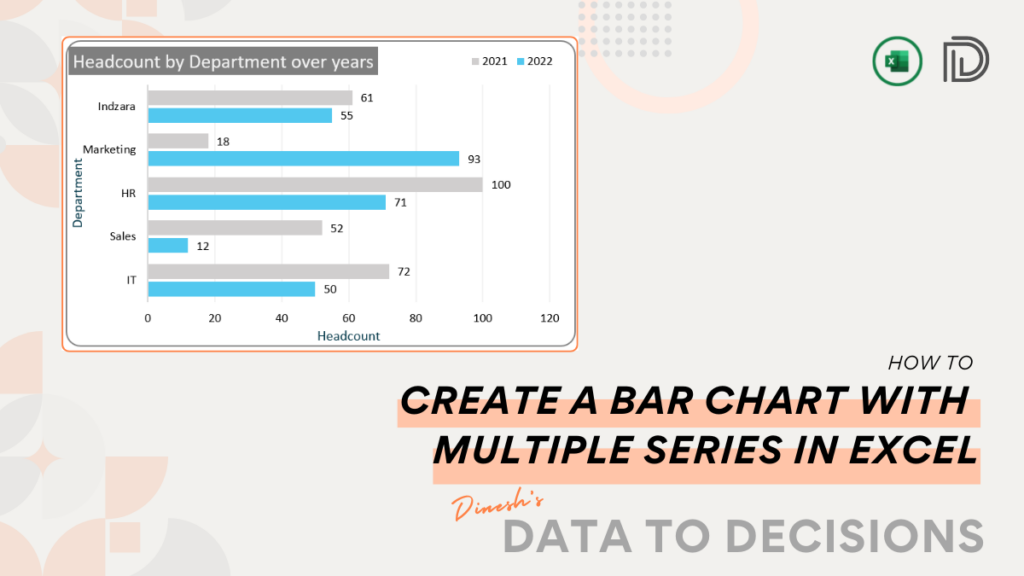
Learn how to create a dynamic bar chart with multiple data series in Excel for clear and compelling data visualization.
This post walks you through all the steps required to create a visually appealing simple bar chart in Microsoft Excel.
This post is all that's needed to create stunning, dynamic waterfall charts in Excel. Learn to build these charts instantly
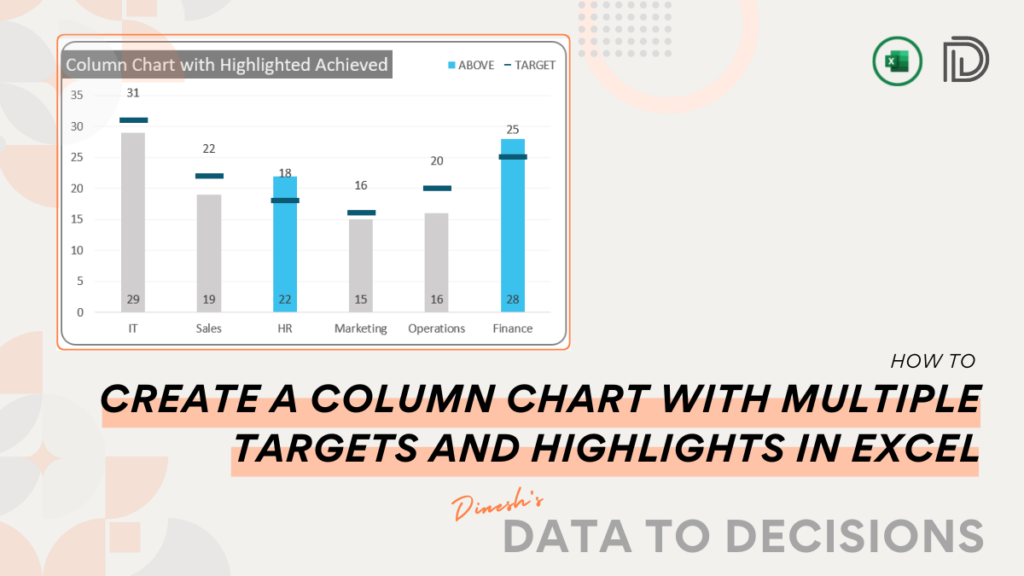
Uncover the steps to build a column chart with multiple targets in Excel, highlighting the achieved columns for an enhanced

