Home » Data to Decision » Page 3
Category: Data to Decision
This post walks you through all the steps required to create a visually appealing simple bar chart in Microsoft Excel.
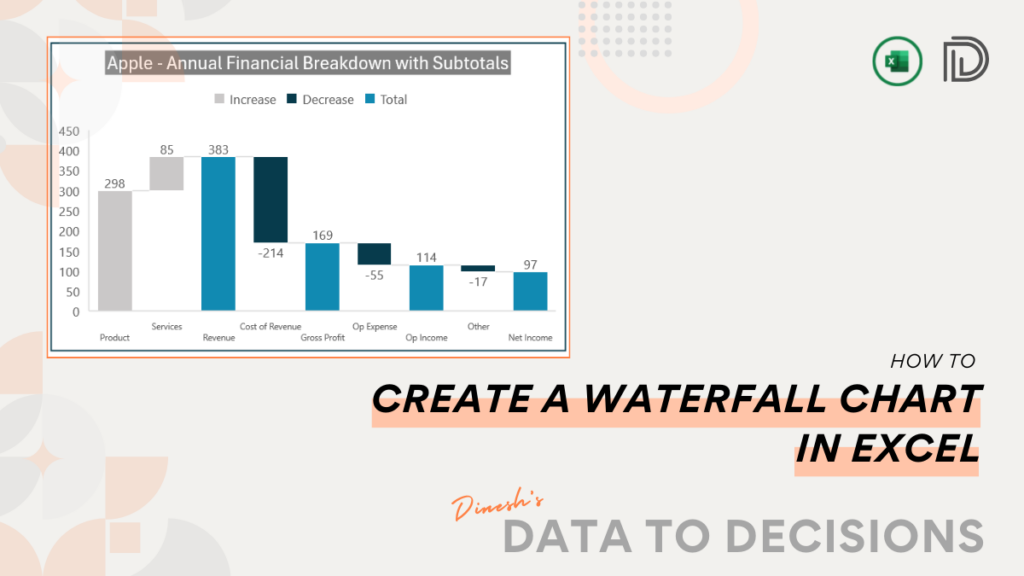
This post is all that's needed to create stunning, dynamic waterfall charts in Excel. Learn to build these charts instantly
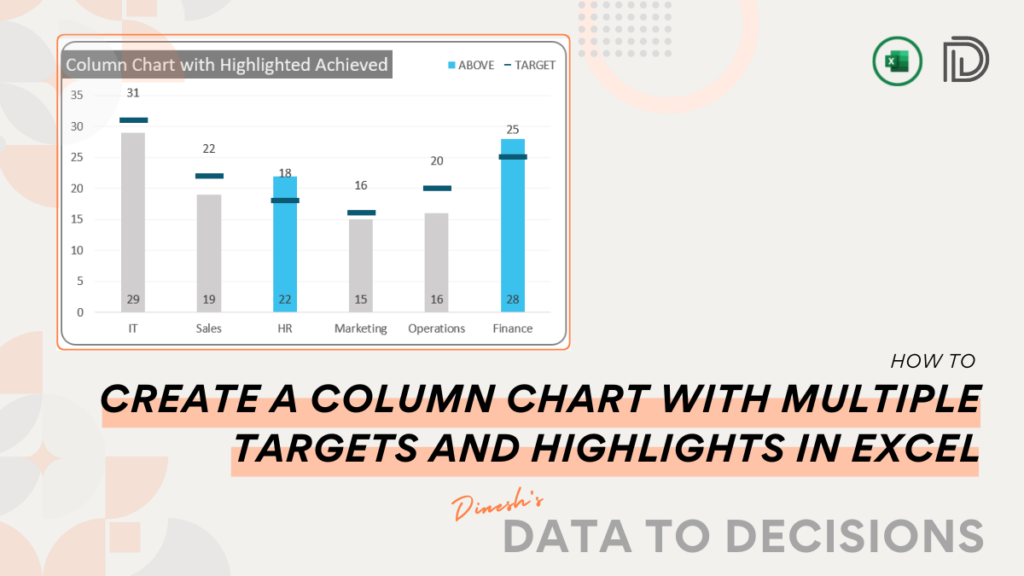
Uncover the steps to build a column chart with multiple targets in Excel, highlighting the achieved columns for an enhanced
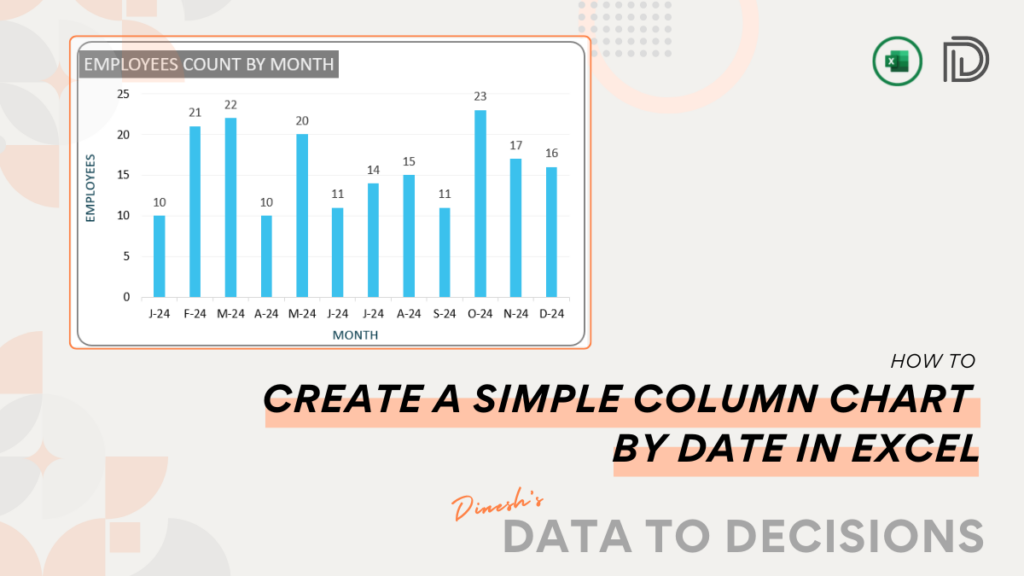
Create a visually appealing column chart in Excel for your time series data. This is great for comparing your data
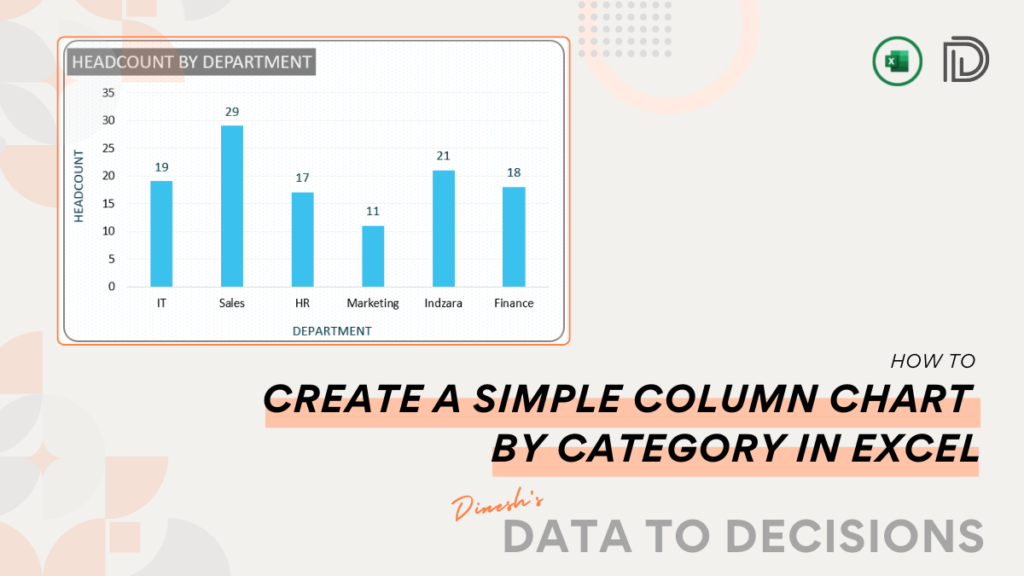
Turn your raw data into a compelling visual with a simple column chart in Microsoft Excel, apt for comparisons by
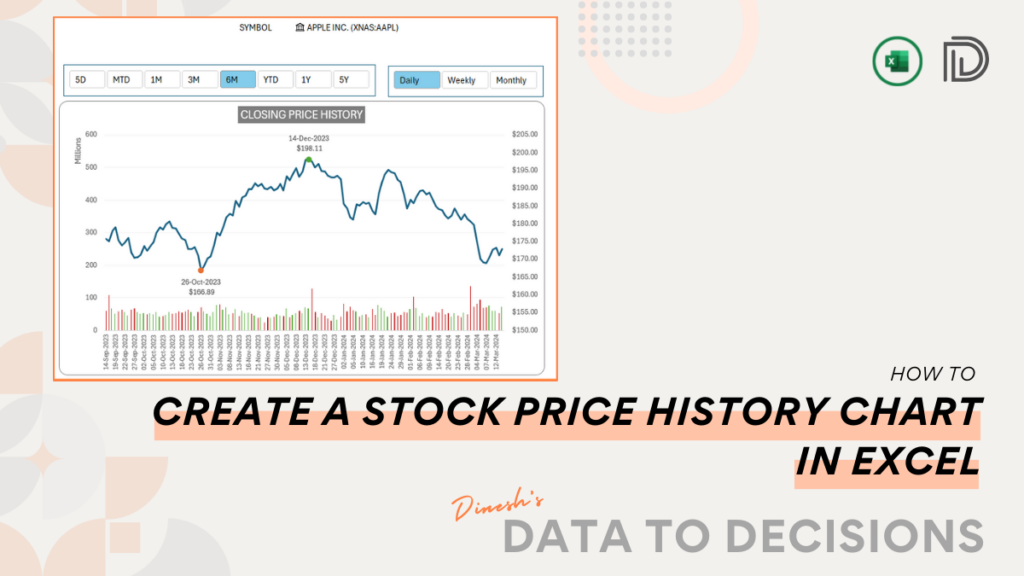
Learn to create a stock price history chart in Excel, a perfect tool for tracking market trends - ready in
Learn to create detailed Waterfall Charts in Excel with this blog post. We cover three variations to suit any data
Follow this post to create a progress tracker using stacked column charts within minutes in Microsoft Excel!
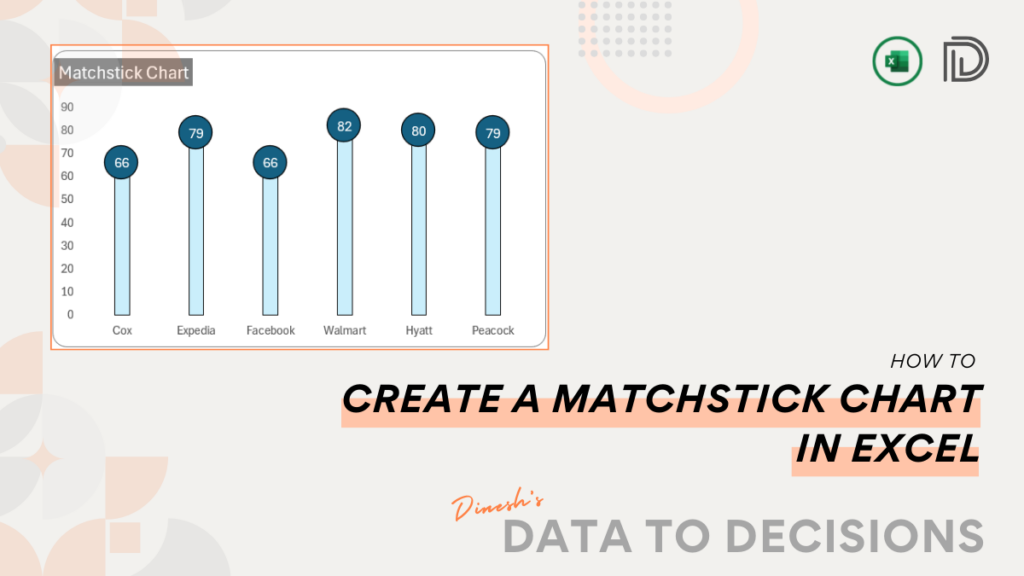
This post will walk you through the steps to turn numbers into engaging, clear visuals by creating a Matchstick chart
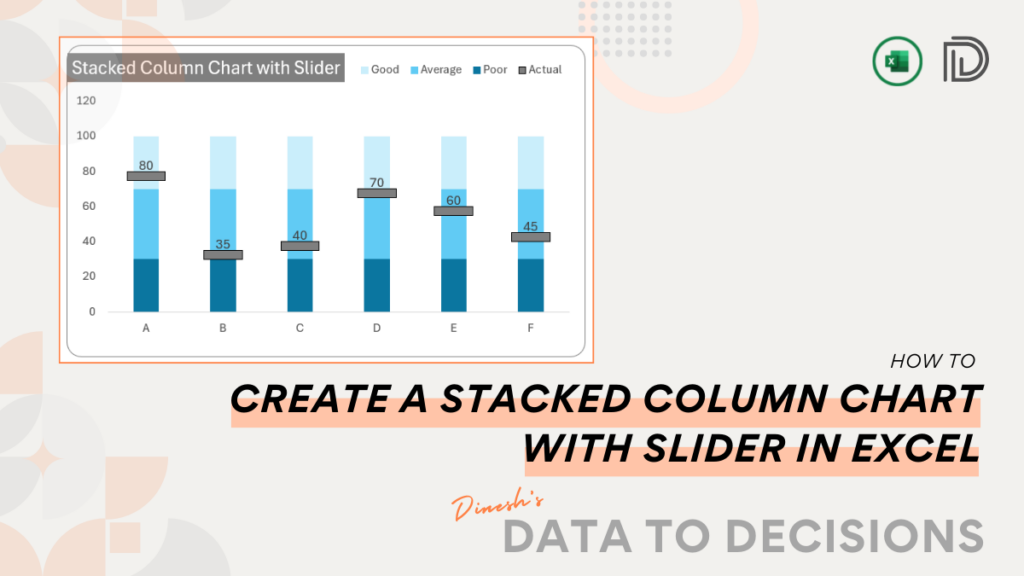
Elevate your data visualization skills by learning to create a Stacked Column Chart with a Slider in Excel through this


