Home » Data to Decision » Page 4
Category: Data to Decision
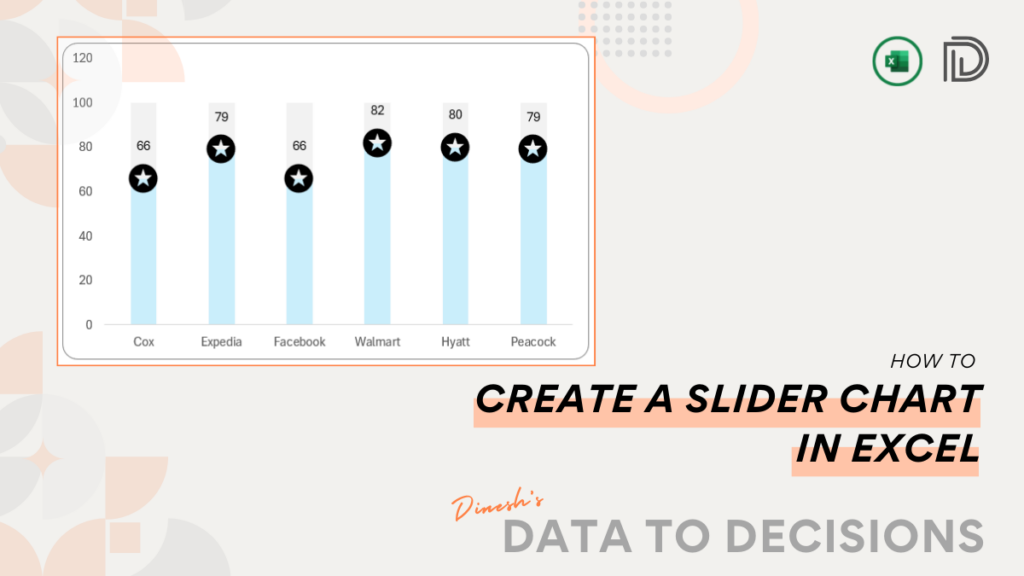
Learn how to create a Slider Chart in Excel - Enhance your presentations with this simple chart and turn raw
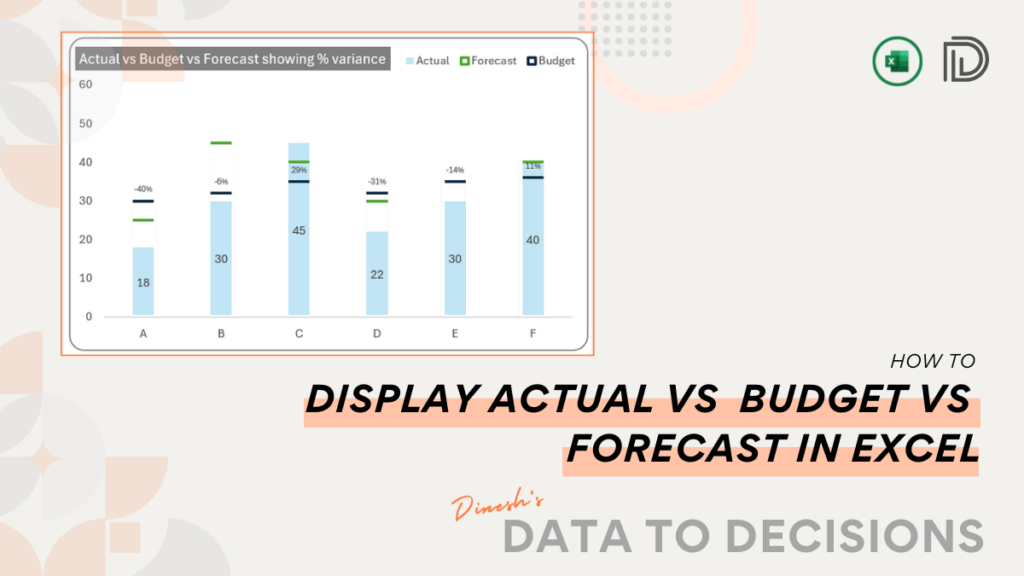
Acquire the crucial techniques to accurately contrast Actual, Budget, and Forecast data through a straightforward chart designed in Microsoft Excel.
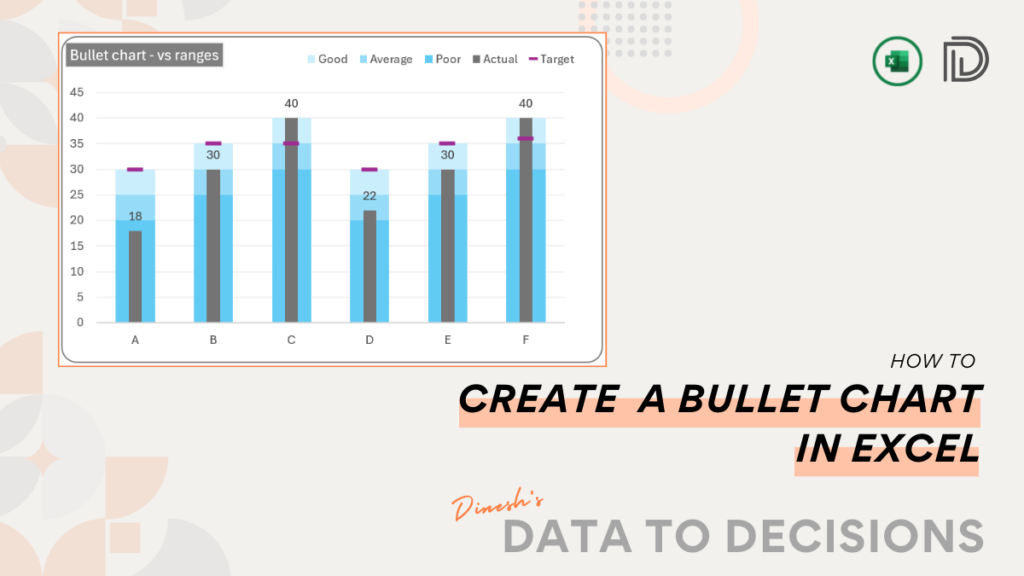
Elevate your data visualization expertise with advanced bullet chart techniques in Excel, designed for a sophisticated comparison of actual performance
Become proficient in data storytelling by following this post to design an Actual vs. Target chart in Excel. This tutorial
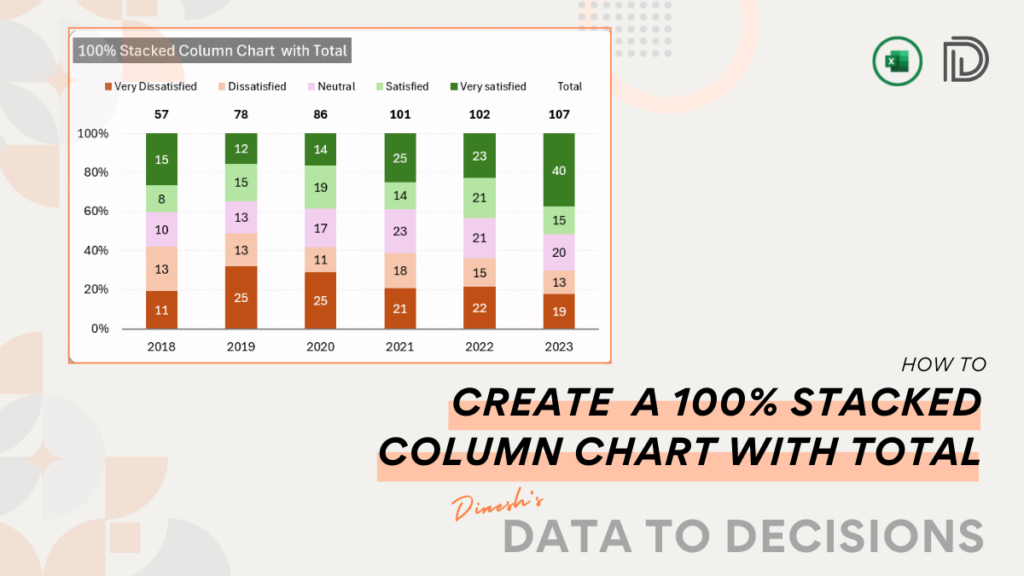
Craft a 100% stacked column chart in Microsoft Excel, showcasing not just the proportional contributions of each data series but
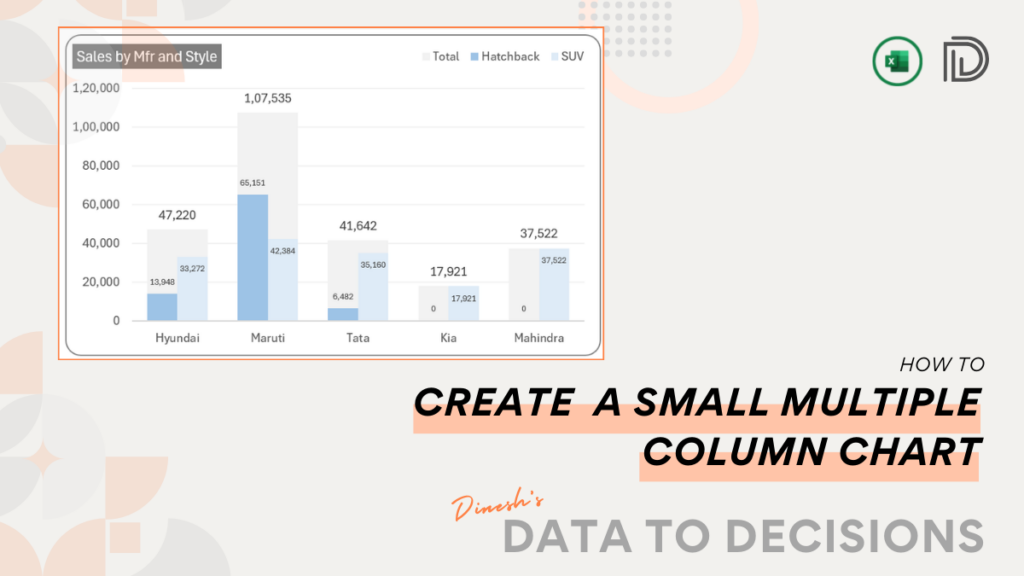
Learn to create a small multiple column chart that displays the data comparison and analysis and enhance your visual reporting.
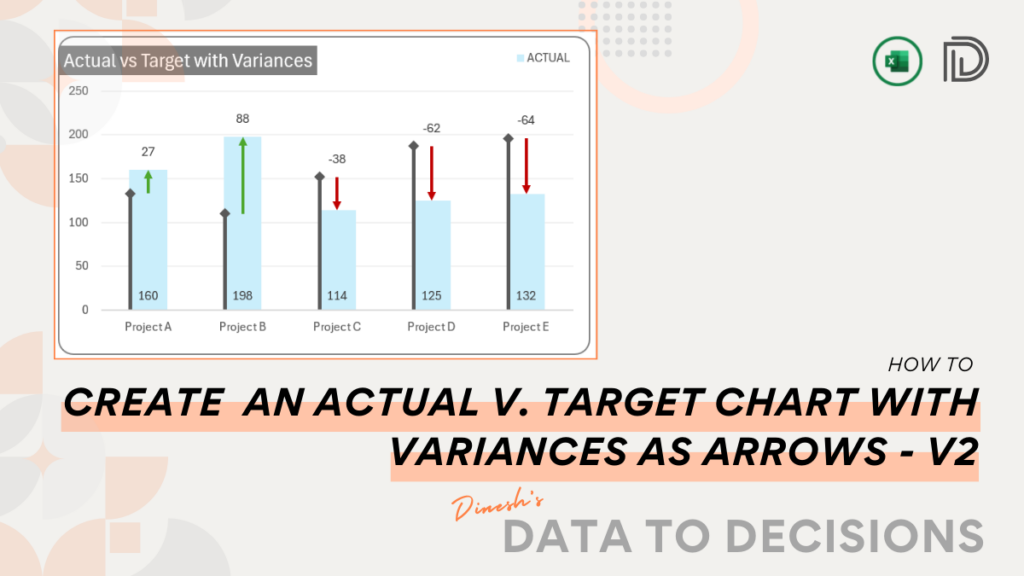
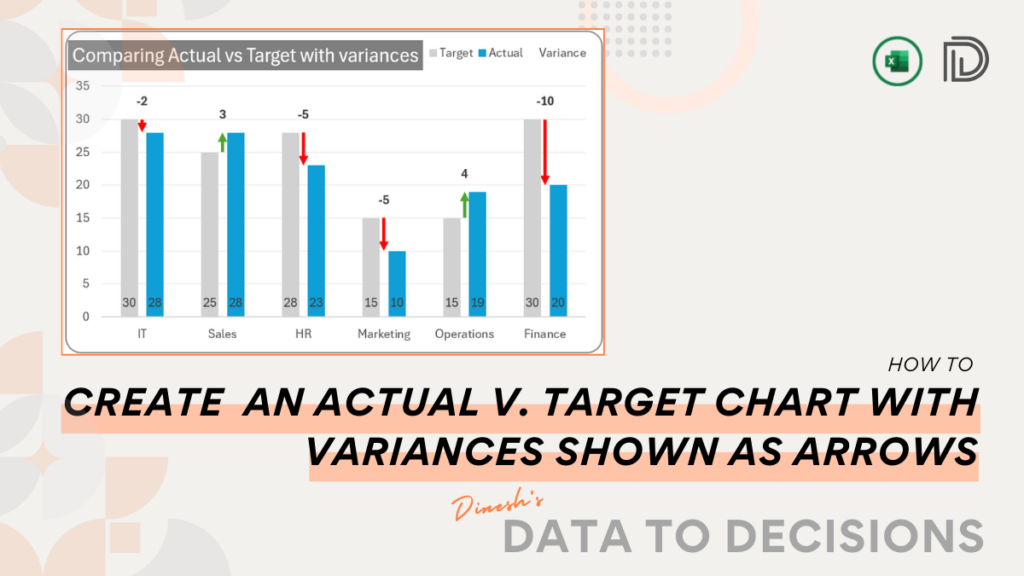
Learn the simplest method to create a dynamic Actual vs Target and variances displayed with arrows chart in Excel. Perfect
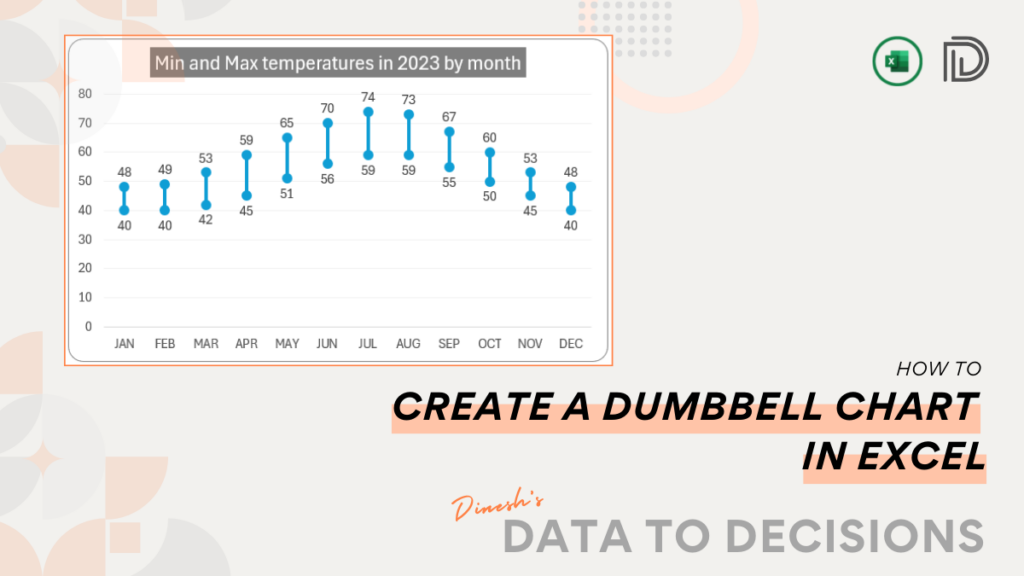
Learn the quickest method to create a dumbbell chart in Excel, a great addition to your regular dashboards and reports!
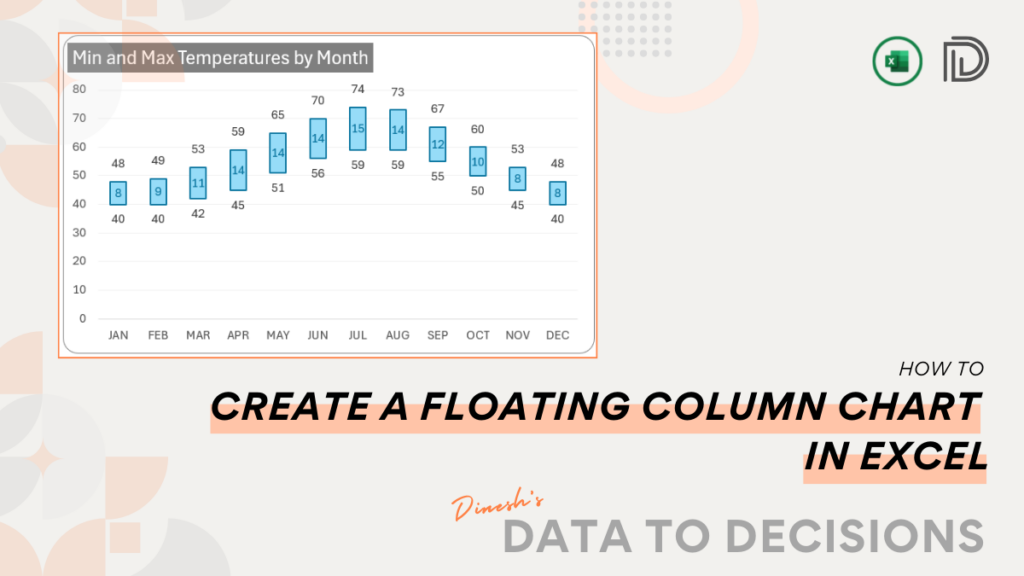
Elevate your data visualization with a step-by-step guide to creating a Floating Column Chart in Excel- a great addition to
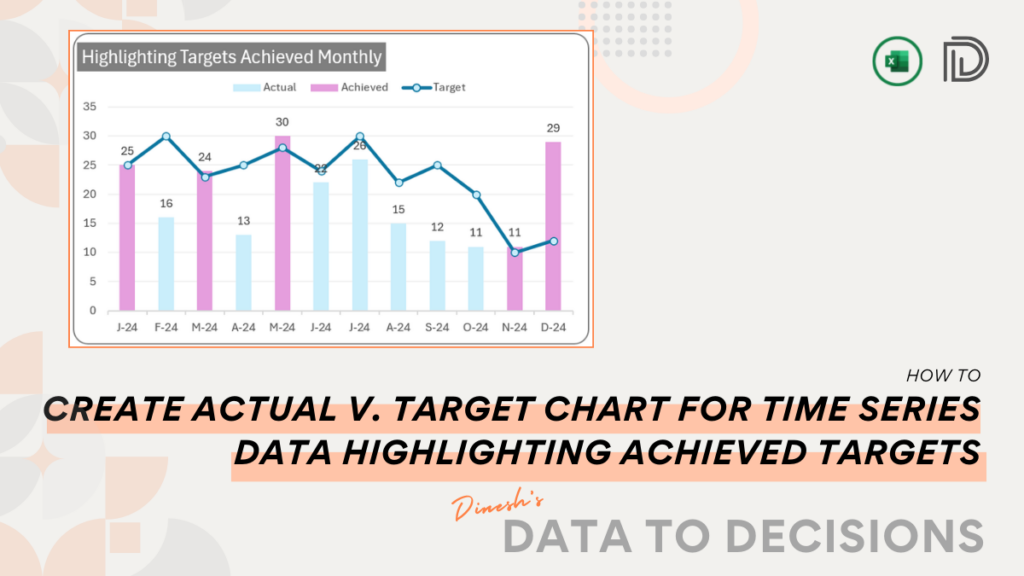
Elevate your charts with our insightful post on creating one that not only compares actual vs. target but also highlights

